Free Shipping On world wide
- HOME
- PRODUCTS
- IN THE NEWS
- SPECTRUM BLOG
- WEB SPECTRUM VIEWER
-
English
-
USD
Free Shipping On world wide
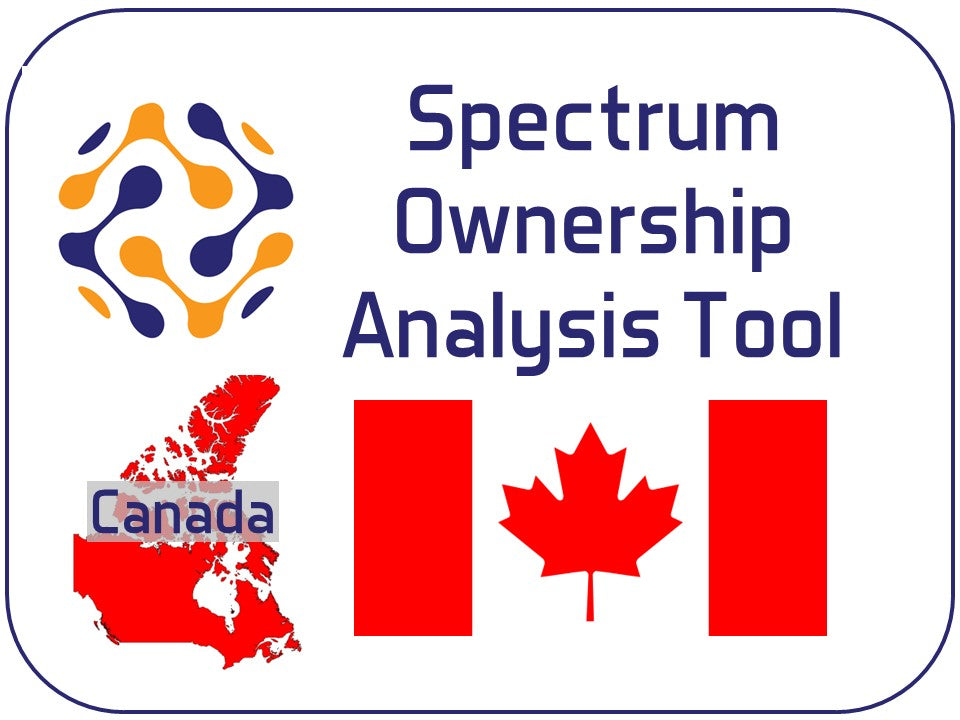
The Spectrum Ownership Analysis Tool is an Excel based product which allows users to visualize and analyze the current spectrum ownership for all of the mobile carrier and satellite frequency bands for Tier 4 Service Areas in all 12 provinces. The Spectrum Ownership Analysis Tool provides analysis for all Canadian carriers. The tool includes a graphical view of the spectrum ownership within a county (Spectrum Grid), a tabular summary of the spectrum holders within each market by spectrum band (Tier 4 Service Area Analysis), a tabular summary of an individual carriers spectrum holdings by band (Carrier Analysis),a tabular summary of an individual carrier's spectrum holdings broken down by NR band class (NR Band Class), a tabular summary of an individual carrier's spectrum holdings by channel (Channel Block) and a calculation of the licensed population for each channel, frequency band, and band classification (Licensed POPS). It also provides an evaluation of the number and size of LTE channels that a carrier's contiguous spectrum would enable them to offer (NR Channel Analysis). You can use the (UL/DL Spectrum) analysis module to evaluate each carriers uplink and downlink spectrum depth. If you are interested in market level analysis, the Spectrum Ownership Analysis Tool includes Tier 2 (Tier 2 Market Analysis), Tier 3 (Tier 3 Market Analysis), and Tier 4 (Tier 4 Market Analysis) modules. Each of these modules provide spectrum depth analysis for 8 user selected carriers. The Market Analysis modules apply a population weighted average to the county-level spectrum ownership data to arrive at a market average. Tier 2 markets approximate provinces, Tier 3 markets approximate partial provinces, and Tier 4 markets approximate counties. To evaluate wireless carrier spectrum ownership for an individual province or the entire nation, our (Province & National) module is also included.
We also recently added two new analysis modules focused on MHz-POPs valuations. (MHz-POPs Detailed) provides a MHz-POP value for a carrier's total spectrum holdings, holdings by band, and holdings by frequency block; all at a county-level. (MHz-POPs - Summary) provides national MHz-POPs values for 8 selected carriers organized for side-by-side comparison. Our Canadian tools utilize 2021 population data.
The Spectrum Ownership Analysis Tool is provided with 4 sources of analysis data; Licensed Holdings, Lease Holdings, Current Holdings, and Future Holdings. The Licensed Holdings data represents the current licensee for each block of spectrum. Lease Holdings reflect the operator that is leasing a block of spectrum including the Lease Identifier. Current Holdings data represent the current operator of each spectrum block including spectrum leases. The Future Holdings data includes the proposed ownership changes that have been filed with Innovation, Science and Economic Development (ISED). A new version of the Spectrum Ownership Analysis Tool is produced by the 5th of each month incorporating all of the previous months updates and transactions.
The Spectrum Analysis Tool is delivered by download from a Cloud service. A link for this download will be provided after your payment has been confirmed. Typically you will have access to the data within the same business day that you process your payment.
Spectrum Bands included:
Mobile Carrier:
| Band | Description |
| 600MHz | Flexible Broadband Service (FBS) (600 MHz) |
| 700MHz | Mobile Broadband Services |
| Cellular | Cellular |
| PCS | Personal Communication Service |
| AWS-1 | Advanced Wireless Service |
| AWS-3 | Advanced Wireless Service - Band 3 |
| AWS-4 | Advanced Wireless Service - Band 4 |
| WCS | Wireless Communication Service |
| BRS | Broadband Radio Service |
| 3500MHz | Flexible Broadband Service (FBS) (3500 MHz) |
| 3800MHz |
Flexible Broadband Service (FBS) (3800 MHz) |