Free Shipping On world wide
- HOME
- PRODUCTS
- IN THE NEWS
- SPECTRUM BLOG
- WEB SPECTRUM VIEWER
-
English
-
USD
Free Shipping On world wide
Spektrum Metrics Insights & Analytics is pleased to announce that our Millimeter Wave - Spectrum Ownership Analysis Tool has been updated with the Auction 103 results and is available for purchase.
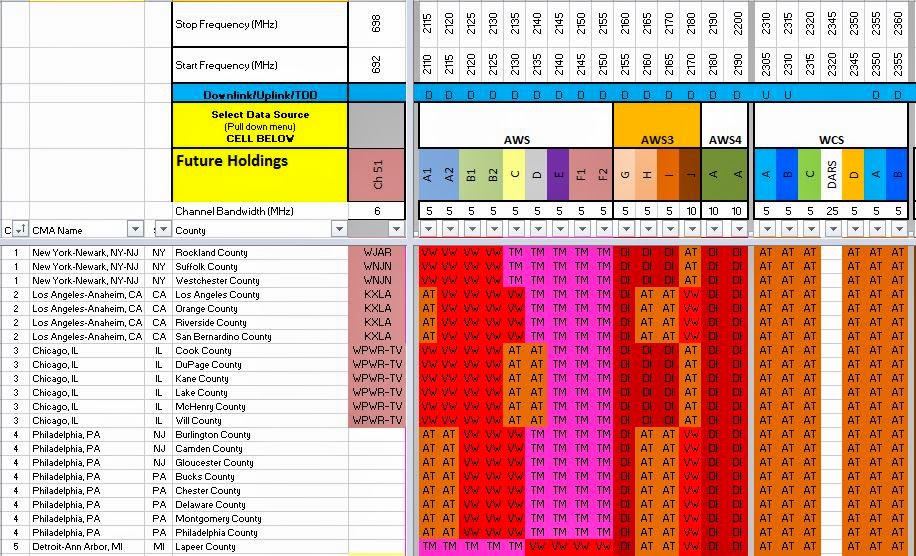
Below is a sample of the Spectrum Grid Analysis Module, highlighting the 37/39 GHz spectrum ownership for the New York, Los Angeles, and Chicago CMA markets.

The Millimeter Wave - Spectrum Ownership Analysis Tool contains 20 additional analysis modules including:
With our Web Spectrum Viewer subscription, maps for each carrier's total Millimeter Wave spectrum depth and their spectrum depth for each frequency band are available. Below is a map for the 47GHz spectrum that Sprint won in Auction 103.
Click here to contact Spektrum Metrics Insights & Analytics.

One of the benefits of Allnet Insights' Spectrum Ownership Analysis Tools, is the repository of monthly releases that we have accumulated. With the USA Mobile Carrier Tool we have monthly versions going back to July 2012. Each of our historical tools details spectrum ownership and the variety of spectrum depth analysis modules that were supported at that time.
I thought it would be interesting to look back at the spectrum ownership landscape from July 2012. Looking first at our Spectrum Grid for low band spectrum, you can see that Verizon still holds the 700MHz B block licenses that were sold later to AT&T. In addition, Verizon also holds the 700MHz A block licenses that were sold to T-Mobile.

Looking next at the lower mid band spectrum, former licensees like SpectrumCo, Leap Wireless, and MetroPCS still control blocks of AWS-1 and PCS spectrum. This view of spectrum ownership also allows you to see how Verizon consolidated their AWS-1 spectrum holdings with SpectrumCo's holdings into a 20 MHz block through spectrum license trades with T-Mobile and their MetroPCS licenses. Today Verizon controls the lower 20 MHz of the AWS-1 band and T-Mobile controls the upper 25 MHz in the New York / New Jersey counties.

Looking at the upper mid band spectrum we first see all of the original WCS spectrum licensees: Horizon Wi-Com, Nextwave, Sprint, Comcast, and San Diego Gas & Electric. Clearwire also appears in the upper mid band Spectrum Grid with their 2.5GHz spectrum holdings.

It is interesting then to look at our County Analysis module to see the detail on each carrier's spectrum depth. It is noteworthy to mention that Verizon has 119 MHz of spectrum in most of the New York / New Jersey counties with AT&T trailing with 91 MHz of spectrum. Verizon still sits with rough the same amount of spectrum although they replaced all of the 700MHz spectrum they sold to AT&T and T-Mobile with SpectrumCo spectrum and AWS-3 spectrum while AT&T has growth while AT&T has grown their spectrum depth in the same counties to 161 MHz.

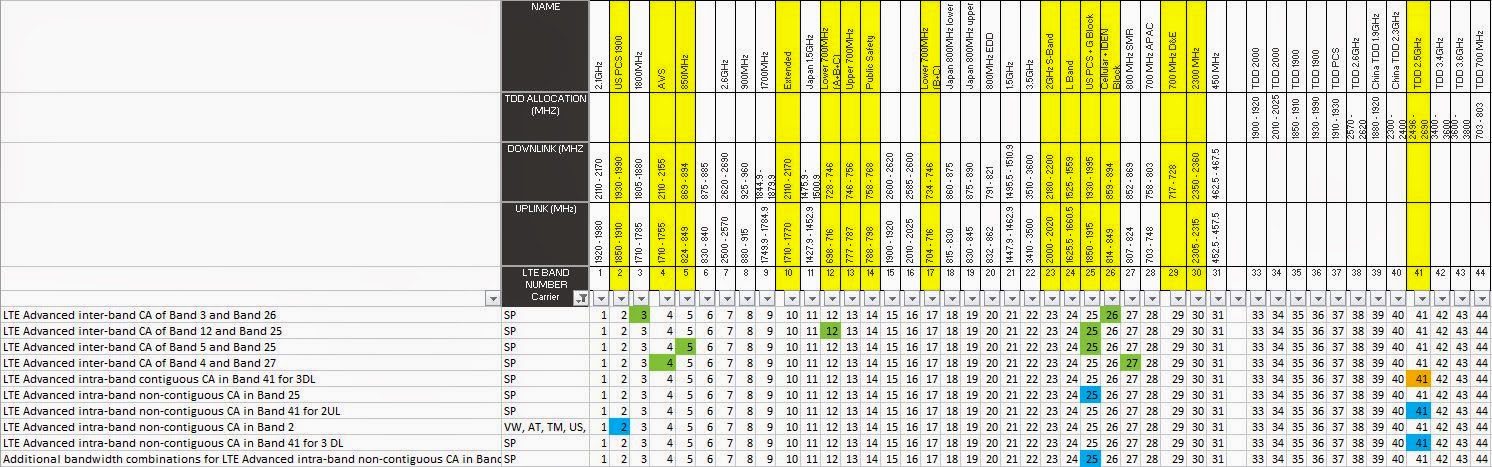
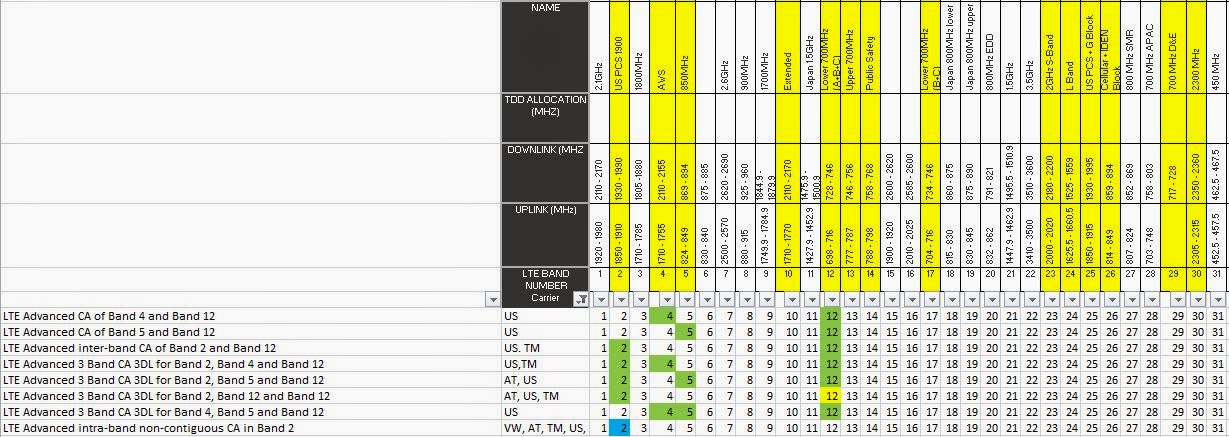
Today, Fierce Wireless had an article examining Rogers 5G roll out announcement. The article states that Rogers will initially deploy using 2.5 GHz spectrum followed by 600 MHz and 3.5 GHz. Although we are familiar with these bands from a US spectrum allocation, it is important to understand several of the differences between the Canadian allocations and the US allocations.
First, we are going to look at the 2.5 GHz band using the Spectrum Grid from our Canadian Mobile Carrier - Spectrum Ownership Analysis Tool. Canada's 2.5 GHz spectrum is configured to the international standard with paired (FDD) LTE Band 7 and TDD band 38/41. In each of the 4 deployment cities, Rogers controls FDD and TDD spectrum. I believe that Rogers will be deploying the TDD/Band 41 spectrum blocks due to its compatibility with Sprint's 5G deployment and the Band 41 ecosystem. Rogers has 20 MHz of spectrum available in each of their roll out markets which should deliver about 30% of the speed performance that Sprint is achieving on their 5G launches.

Second, Rogers will roll out 5G using their 600 MHz low band spectrum. This spectrum is configured identically to the US allocation with 7 x 10 MHz FDD channels in LTE Band 71. Rogers has 10 MHz channels available in all of their roll out markets except Toronto where they have a 20 MHz channel available.

Third, Rogers will roll out 5G in Canada's 3.5 GHz band. In the US, this spectrum is primarily allocated as CBRS spectrum requiring the use of a Spectrum Access System (SAS) with multiple users. The entire CBRS band is 150 MHz while the Canadian 3.5 GHz band is 200 MHz broken up into 20 - 10 MHz (TDD) channels. Canada will be licensing all of this spectrum to carriers, while the US model is shared spectrum. Since the 3.5 GHz auction has not occurred, Rogers spectrum ownership in these markets is unknown. The 3.5 GHz auction will occur sometime in 2020.

Last month, Telus applied and was approved to lease part of the AWS-4 spectrum band in Canada from Terrestar. Terrestar owns both parts (uplink and downlink) of the AWS-4 band for all of Canada. In Canada, the AWS-4 band is still configured for duplex (FDD) operation where in the US, Dish received approval to operate all of the spectrum for downlink.
Telus will be leasing the spectrum in the most urban areas of Canada, not including Toronto with typically 20MHz spectrum leases. Telus is leasing this spectrum over a population of 13 million, roughly 38% of Canada's population. Below are geographic maps indicating each of the areas where Telus will be leasing spectrum. In Canada spectrum leases are called subordinations of licenses. We will discuss why this spectrum is important to Telus below with outputs from our Canadian Mobile Carrier - Spectrum Ownership Analysis Tool.


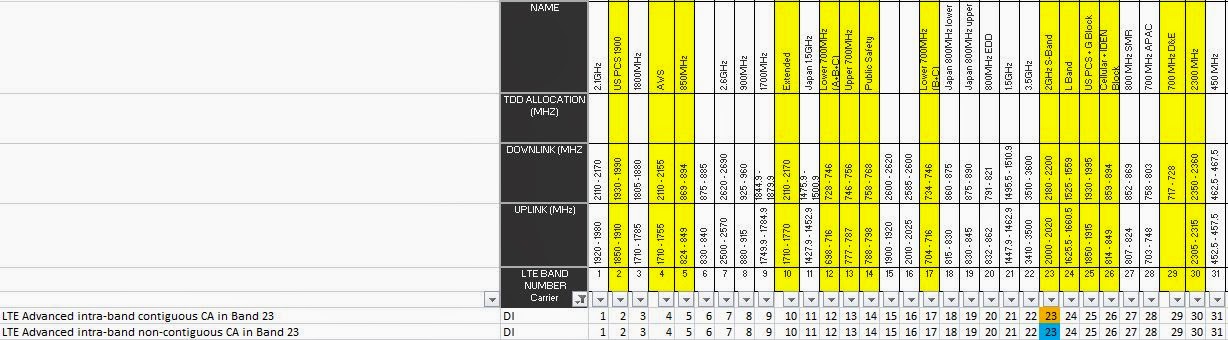
From the Spectrum Grid below, Telus is acquiring the downlink AWS-4 spectrum which lies within Band 66 which is now widely deployed in the US for both the AWS-1 and AWS-3 bands. This will provide immediate service improvements once the network is constructed because handsets have been supporting Band 66 for several years. The remaining part of the AWS-4 spectrum (for uplink), would fall into Band 23, which has little to no handset support.

We can see a second reason for acquiring this spectrum by looking at the Company Analysis module, detailing Telus's spectrum holdings in each of these Tier 4 service areas.

In many of these Tier 4 service areas (similar to US counties), Telus has limited or no BRS (2.5GHz) spectrum. The BRS spectrum they do control in these markets is paired (FDD) Band 7 rather than the TDD Band 41 that Sprint controls in the US. Overall, this spectrum acquisition provides Telus with an immediate capacity improvement since they can expand their Band 66 downlink capacity by 10 or 20MHz.
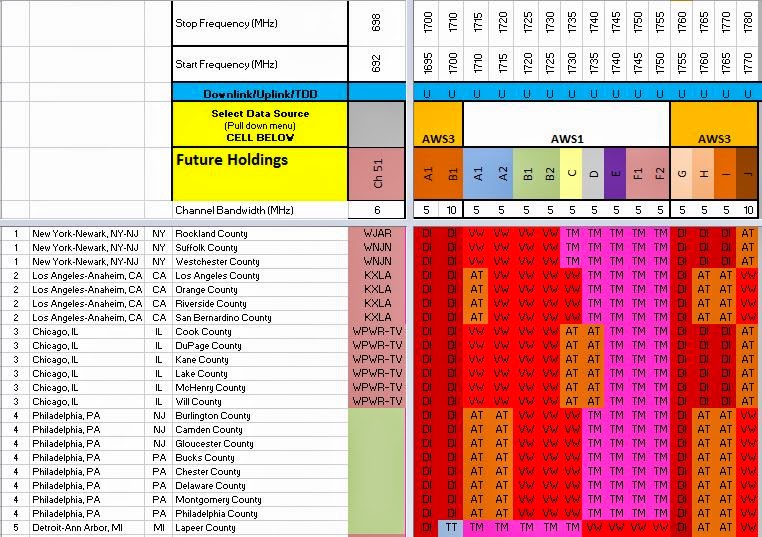
In July, the FCC released their report and order for their plans to auction the white space 2.5 GHz spectrum. Using our Mobile Carrier - Spectrum Ownership Analysis Tool we have created a couple of images to illustrated the auction of the spectrum in a rural county and the auction of spectrum in a urban county.
Our rural example focuses on Wayne County, Iowa. Wayne County has a population of nearly 6,500.

In the image above, we indicate the primary spectrum ownership for each channel in Wayne, IA. Sprint is the spectrum owner for all of the BRS (Broadband Radio Service) channels and the FCC is the spectrum owner for all of the EBS (Educational Broadcast Service) channels. We have highlighted in the Bandwidth row, the different channels the FCC has defined for auction. The red highlights are for the 49.5MHz channel, the green highlights indicate the channels included in the 50.5MHz channel and the blue highlights indicate the channels included in 17.5MHz channel. The 17.5MHz channel consists of 3 x 5.5MHz contiguous channels and 3 x 0.33MHz guard band channels.
In the area below each channel we indicate in green, the available population that can be licensed for each channel as a percentage. Clearly, purchasing any of the 3 channels (49.5, 50.5, 17.5) at auction would provide a carrier with the ability to service 100% of the population with each of the component 2.5GHz channels.
Our urban example focuses on McHenry County, IL. McHenry County has a population of nearly 310,000. McHenry County is one of the 6 counties that constitute the Chicago CMA Market.

In the urban example, the carrier that purchases the red (49.5MHz) channel would be able build a network reaching 20% of the population with the A1, A2, and A3 channels (16.5MHz), they would be able to reach 80% of the population with the B1, B2, B3, and C3 channels, and they can reach the entire population with the C1 and C2 channels. The auction winning carrier will have to coordinate their operations for all but the C1 and C2 channels around the geographic license areas that Sprint already controls.
Two questions for all of the wireless network installers and drive testers:
1) Where can you get the spectrum assignments for all of the mobile carrier bands with in a county?
2) How can you determine if the licensed spectrum assignment will change in the near future?
Allnet Insights' Web Spectrum Viewer now includes a Wireless Survey which details the wireless carrier that currently controls each block of Mobile Carrier spectrum (600MHz-2.5GHz) for a selected US county. In addition, the Wireless Survey indicates whether there are any filed transaction that will move that spectrum to another wireless carrier, as indicated in the Future column.
The output table details the spectrum assignment's,licensees, and bandwidth for each block and is sorted from lowest frequency to highest frequency. This output table can be exported as a .csv file.


| Purpose | Assignee | Assignor | CallSign | Map | RadioService | Market | ChannelBlock |
| New Lease | Cimaron Telephone | Cross Telephone Company | WRBQ838 | AWS3 | CMA598 - Oklahoma 3 - Grant | G | |
| New Lease | GE MDS LLC | Access 700 | WPRR314 | 700MHz GB | MEA025 - Nashville | A | |
| New Lease | GE MDS LLC | Access 700 | WPRV427 | 700MHz GB | MEA008 - Atlanta | A | |
| New Lease | GE MDS LLC | Access 700 | WPRV430 | 700MHz GB | MEA024 - Birmingham | A | |
| New Lease | GE MDS LLC | Access 700 | WPRV439 | 700MHz GB | MEA038 - San Antonio | A | |
| New Lease | SpeedConnect | Sprint | B064 | Map | BRS | BTA064 - Butte, MT | BRS1 |
| New Lease | SpeedConnect | Sprint | B064 | Map | BRS | BTA064 - Butte, MT | E4 |
| New Lease | SpeedConnect | Sprint | B064 | Map | BRS | BTA064 - Butte, MT | F1 |
| New Lease | SpeedConnect | Sprint | B064 | Map | BRS | BTA064 - Butte, MT | F2 |
| New Lease | SpeedConnect | Sprint | B064 | Map | BRS | BTA064 - Butte, MT | F3 |
| New Lease | SpeedConnect | Sprint | B064 | Map | BRS | BTA064 - Butte, MT | F4 |
| New Lease | SpeedConnect | Sprint | B064 | Map | BRS | BTA064 - Butte, MT | H1 |
| New Lease | SpeedConnect | Sprint | B064 | Map | BRS | BTA064 - Butte, MT | H2 |
| New Lease | SpeedConnect | Sprint | B064 | Map | BRS | BTA064 - Butte, MT | H3 |
| New Lease | SpeedConnect | Sprint | B144 | Map | BRS | BTA144 - Flagstaff, AZ | BRS1 |
| New Lease | SpeedConnect | Sprint | B144 | Map | BRS | BTA144 - Flagstaff, AZ | E4 |
| New Lease | SpeedConnect | Sprint | B144 | Map | BRS | BTA144 - Flagstaff, AZ | F4 |
| New Lease | SpeedConnect | Sprint | B167 | Map | BRS | BTA167 - Grand Island-Kearney, NE | BRS1 |
| New Lease | SpeedConnect | Sprint | B171 | Map | BRS | BTA171 - Great Falls, MT | BRS2 |
| New Lease | SpeedConnect | Sprint | B171 | Map | BRS | BTA171 - Great Falls, MT | E1 |
| New Lease | SpeedConnect | Sprint | B171 | Map | BRS | BTA171 - Great Falls, MT | E2 |
| New Lease | SpeedConnect | Sprint | B171 | Map | BRS | BTA171 - Great Falls, MT | E3 |
| New Lease | SpeedConnect | Sprint | B171 | Map | BRS | BTA171 - Great Falls, MT | E4 |
| New Lease | SpeedConnect | Sprint | B171 | Map | BRS | BTA171 - Great Falls, MT | F1 |
| New Lease | SpeedConnect | Sprint | B171 | Map | BRS | BTA171 - Great Falls, MT | F4 |
| New Lease | SpeedConnect | Sprint | B202 | Map | BRS | BTA202 - Idaho Falls, ID | BRS1 |
| New Lease | SpeedConnect | Sprint | B202 | Map | BRS | BTA202 - Idaho Falls, ID | BRS2 |
| New Lease | SpeedConnect | Sprint | B202 | Map | BRS | BTA202 - Idaho Falls, ID | E4 |
| New Lease | SpeedConnect | Sprint | B202 | Map | BRS | BTA202 - Idaho Falls, ID | F4 |
| New Lease | SpeedConnect | Sprint | B205 | Map | BRS | BTA205 - Iowa City, IA | BRS1 |
| New Lease | SpeedConnect | Sprint | B205 | Map | BRS | BTA205 - Iowa City, IA | BRS2 |
| New Lease | SpeedConnect | Sprint | B205 | Map | BRS | BTA205 - Iowa City, IA | E4 |
| New Lease | SpeedConnect | Sprint | B205 | Map | BRS | BTA205 - Iowa City, IA | F4 |
| New Lease | SpeedConnect | Sprint | B300 | Map | BRS | BTA300 - Missoula, MT | BRS1 |
| New Lease | SpeedConnect | Sprint | B353 | Map | BRS | BTA353 - Pocatello, ID | BRS1 |
| New Lease | SpeedConnect | Sprint | B353 | Map | BRS | BTA353 - Pocatello, ID | BRS2 |
| New Lease | SpeedConnect | Sprint | B353 | Map | BRS | BTA353 - Pocatello, ID | E4 |
| New Lease | SpeedConnect | Sprint | B353 | Map | BRS | BTA353 - Pocatello, ID | F4 |
| New Lease | SpeedConnect | Sprint | B422 | Map | BRS | BTA422 - Sioux Falls, SD | BRS1 |
| New Lease | SpeedConnect | Sprint | B422 | Map | BRS | BTA422 - Sioux Falls, SD | BRS2 |
| New Lease | SpeedConnect | Sprint | B422 | Map | BRS | BTA422 - Sioux Falls, SD | E4 |
| New Lease | SpeedConnect | Sprint | B422 | Map | BRS | BTA422 - Sioux Falls, SD | F4 |
| New Lease | SpeedConnect | Sprint | B451 | Map | BRS | BTA451 - Twin Falls, ID | BRS1 |
| New Lease | SpeedConnect | Sprint | B451 | Map | BRS | BTA451 - Twin Falls, ID | E4 |
| New Lease | SpeedConnect | Sprint | B451 | Map | BRS | BTA451 - Twin Falls, ID | F4 |
| New Lease | SpeedConnect | Sprint | WFY431 | Map | BRS | P00089 - P35 GSA,40-43-38 N,99-7-41.3 W | BRS1 |
| New Lease | SpeedConnect | Sprint | WFY595 | Map | BRS | P03002 - P35 GSA,41-32-48.1 N,90-27-56.5 W | BRS1 |
| New Lease | SpeedConnect | Sprint | WGW275 | Map | BRS | P03471 - P35 GSA,43-28-24.1 N,83-50-39.9 W | E4 |
| New Lease | SpeedConnect | Sprint | WHI959 | Map | BRS | P00168 - P35 GSA,43-59-30.9 N,96-46-11.2 W | F4 |
| New Lease | SpeedConnect | Sprint | WHT588 | Map | BRS | P03685 - P35 GSA,41-31-58.1 N,90-34-40.5 W | E4 |
| New Lease | SpeedConnect | Sprint | WLK328 | Map | BRS | P01359 - P35 GSA,43-14-38 N,97-22-39.2 W | F4 |
| New Lease | SpeedConnect | Sprint | WLK384 | Map | BRS | P01362 - P35 GSA,43-14-38 N,97-22-39.2 W | E4 |
| New Lease | SpeedConnect | Sprint | WLW827 | Map | BRS | P01384 - P35 GSA,31-25-16.6 N,100-32-37.3 W | F1234 |
| New Lease | SpeedConnect | Sprint | WLW894 | Map | BRS | P01898 - P35 GSA,41-31-58.1 N,90-34-40.5 W | F4 |
| New Lease | SpeedConnect | Sprint | WMH800 | Map | BRS | P02690 - P35 GSA,34-13-58.1 N,112-22-15.6 W | E4 |
| New Lease | SpeedConnect | Sprint | WMI345 | Map | BRS | P01925 - P35 GSA,41-54-33 N,91-39-17.6 W | E4 |
| New Lease | SpeedConnect | Sprint | WMI827 | Map | BRS | P02939 - P35 GSA,34-42-17.1 N,112-6-57.6 W | E4 |
| New Lease | SpeedConnect | Sprint | WMI864 | Map | BRS | P02941 - P35 GSA,34-42-17.1 N,112-6-57.6 W | F4 |
| New Lease | SpeedConnect | Sprint | WML478 | Map | BRS | P03544 - P35 GSA,31-25-16.6 N,100-32-37.3 W | BRS1 |
| New Lease | SpeedConnect | Sprint | WMX344 | Map | BRS | P03719 - P35 GSA,43-30-10.9 N,96-34-39.2 W | F4 |
| New Lease | SpeedConnect | Sprint | WMX358 | Map | BRS | P01947 - P35 GSA,43-30-10.9 N,96-34-39.2 W | E4 |
| New Lease | SpeedConnect | Sprint | WMX656 | Map | EBS | P00155 - P35 GSA,42-43-54 N,114-25-7 W | D1234 |
| New Lease | SpeedConnect | Sprint | WMX678 | Map | EBS | P00017 - P35 GSA,42-43-54 N,114-25-7 W | C1234 |
| New Lease | SpeedConnect | Sprint | WMX908 | Map | BRS | P03551 - P35 GSA,31-25-16.6 N,100-32-37.3 W | E1234 |
| New Lease | SpeedConnect | Sprint | WNTC543 | Map | BRS | P01566 - P35 GSA,31-25-16.6 N,100-32-37.3 W | H1 |
| New Lease | SpeedConnect | Sprint | WNTC543 | Map | BRS | P01566 - P35 GSA,31-25-16.6 N,100-32-37.3 W | H2 |
| New Lease | SpeedConnect | Sprint | WQLW472 | Map | BRS | BTA070 - Cedar Rapids, IA | BRS2 |
| New Lease | SpeedConnect | Sprint | WQLW472 | Map | BRS | BTA070 - Cedar Rapids, IA | E4 |
| New Lease | SpeedConnect | Sprint | WQLW472 | Map | BRS | BTA070 - Cedar Rapids, IA | F4 |
| New Lease | SpeedConnect | Sprint | WQLW474 | Map | BRS | BTA105 - Davenport, IA-Moline, IL | BRS2 |
| New Lease | SpeedConnect | Sprint | WLW970 | Map | BRS | P02673 - P35 GSA,35-14-2 N,111-36-27.6 W | F4 |
| New Lease | SpeedConnect | Sprint | WMI320 | Map | BRS | P02694 - P35 GSA,35-14-29 N,111-36-37.6 W | E4 |
| New Lease | SpeedConnect | Sprint | B011 | Map | BRS | BTA011 - Alpena, MI | BRS1 |
| New Lease | SpeedConnect | Sprint | B011 | Map | BRS | BTA011 - Alpena, MI | E4 |
| New Lease | SpeedConnect | Sprint | B011 | Map | BRS | BTA011 - Alpena, MI | F1 |
| New Lease | SpeedConnect | Sprint | B011 | Map | BRS | BTA011 - Alpena, MI | F2 |
| New Lease | SpeedConnect | Sprint | B011 | Map | BRS | BTA011 - Alpena, MI | F3 |
| New Lease | SpeedConnect | Sprint | B011 | Map | BRS | BTA011 - Alpena, MI | F4 |
| New Lease | SpeedConnect | Sprint | B011 | Map | BRS | BTA011 - Alpena, MI | H1 |
| New Lease | SpeedConnect | Sprint | B011 | Map | BRS | BTA011 - Alpena, MI | H2 |
| New Lease | SpeedConnect | Sprint | B011 | Map | BRS | BTA011 - Alpena, MI | H3 |
| New Lease | SpeedConnect | Sprint | B307 | Map | BRS | BTA307 - Mt. Pleasant, MI | E4 |
| New Lease | SpeedConnect | Sprint | B307 | Map | BRS | BTA307 - Mt. Pleasant, MI | F4 |
| New Lease | SpeedConnect | Sprint | B390 | Map | BRS | BTA390 - Saginaw-Bay City, MI | E4 |
| New Lease | SpeedConnect | Sprint | B390 | Map | BRS | BTA390 - Saginaw-Bay City, MI | F4 |
| New Lease | T-Mobile | RigNet | WPWV330 | 700MHz | CMA306 - Gulf of Mexico | C |
On April 19th, the FCC opened a docket to collect comments related to "Transforming the 2.5 GHz Band". As background, the US 2.5GHz spectrum band encompasses 33 channels. 20 channels (A, B, C, D, and G groups) are designated for Educational Broadcast Service (EBS) and 13 (BRS1/2, E, F, and H) are designated for Broadband Radio Service (BRS).
License Area:
Sprint owns a vast majority of the BRS licenses and leases a vast majority of the EBS licenses. The licensing limitations for this spectrum are drawn from its origins providing broadcast video services. The original licenses were formed as 35 mile radius circles centered on the video transmitting site. When two licenses overlapped, a football shaped area would be formed. A line would be drawn through the end points of the "football" splitting the overlapping license area between the two licensees. BRS licenses include both 35 mile radius licenses, geographic area licenses (entire BTA) and Entire BTA license with cutouts for existing 35 mile radius licenses.
In 2009, a Broadband Radio Service auction (Auction 86) included the remaining unlicensed areas within each BTA for the BRS channels, but the unlicensed area in each BTA for the EBS channels was not auctioned.
Channel Plan Transition:
Prior to this point, Clearwire was launching pre-WiMax networks on the EBS/BRS pre-transition band plan which was designed around video operation. As you can see in the Pre-Transition chart below, the A channels (A1, A2, A3, and A4) are separated by the B channels (B1, B2, B3, and B4). This allowed all of the A channels to be broadcast at a video site without interference. Clearwire would need to control both sets of the "interleaved" channels to have enough contiguous spectrum to launch their RAN network in a market.

To facilitate data network deployments and to protect the remaining video operations the FCC provided a way to transistion licenses to the Post-Transition band plan on a BTA market basis. If there was a significant commercial video operation in a market, that BTA market was able waived from transition and it stayed with the Pre-Transition band plan. The Post-Transition band plan put the remaining video operators into the mid-band segment (A4, B4, C4, D4, G4, F4, and E4) and provides contiguous spectrum (16.5MHz) for the rest of the channel group (e.g. A1, A2, and A3)
FCC Request for Comments:
License Area:
The FCC has expressed a desire to make the EBS unlicensed area available for use. The FCC has asked whether the expansion of the licenses should include the entirety of the census tracks that license (35 mile) intersects or the entire county that the license intersects. The map below from the National EBS Association (NEBSA) illustrates the counties that would be added to each intersecting EBS license for the A1 channel. For the carriers that already lease these licenses, they would have the opportunity to deploy sites on the larger license area and would likely also pay the licensee a higher monthly payment due to the increase in licensed population. As you can also note below, this approach still leaves all of the white counties unlicensed.

The FCC would like to license the white counties in a 4 step manner:
Service Rules:
The FCC is also proposing to change the service rules for the EBS spectrum to allow the spectrum to be sold to commercial operators rather than requiring leases.
Remaining Pre-transition Markets:
The FCC is also proposing to complete transitioning the remaining pre-transition markets so a consistent band plan would be in use nationwide. A few wireless cable operators had received waivers but most of those operators have ceased operations. This will clear interference issues between markets and facilitate the deployment of data in the Lower Band Segment (A,B,C, and D groups) and the Upper Band Segment (E,F,G, and H groups). Video operations will continue in the Mid Band Segment (A4, B4, C4, D4,G4,F4, and E4) in the markets where they operate today.
In my most recent post on the filed FCC Transactions for February 2017 there were over 275 call signs that were assigned to new licensees and nearly 100 call signs that were leased. In an industry driven by spectrum, these changes affect the operations for every wireless carrier, they change site interference, and they affect the channels that are programmed into private repeaters and DAS systems.
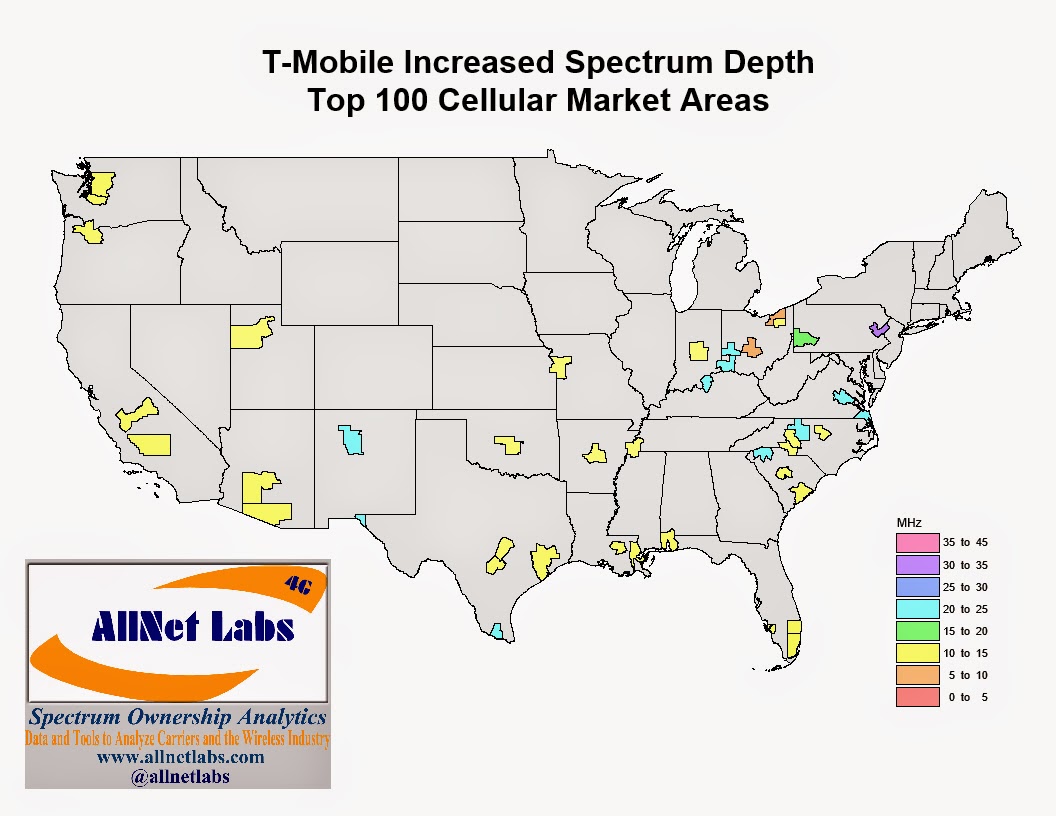
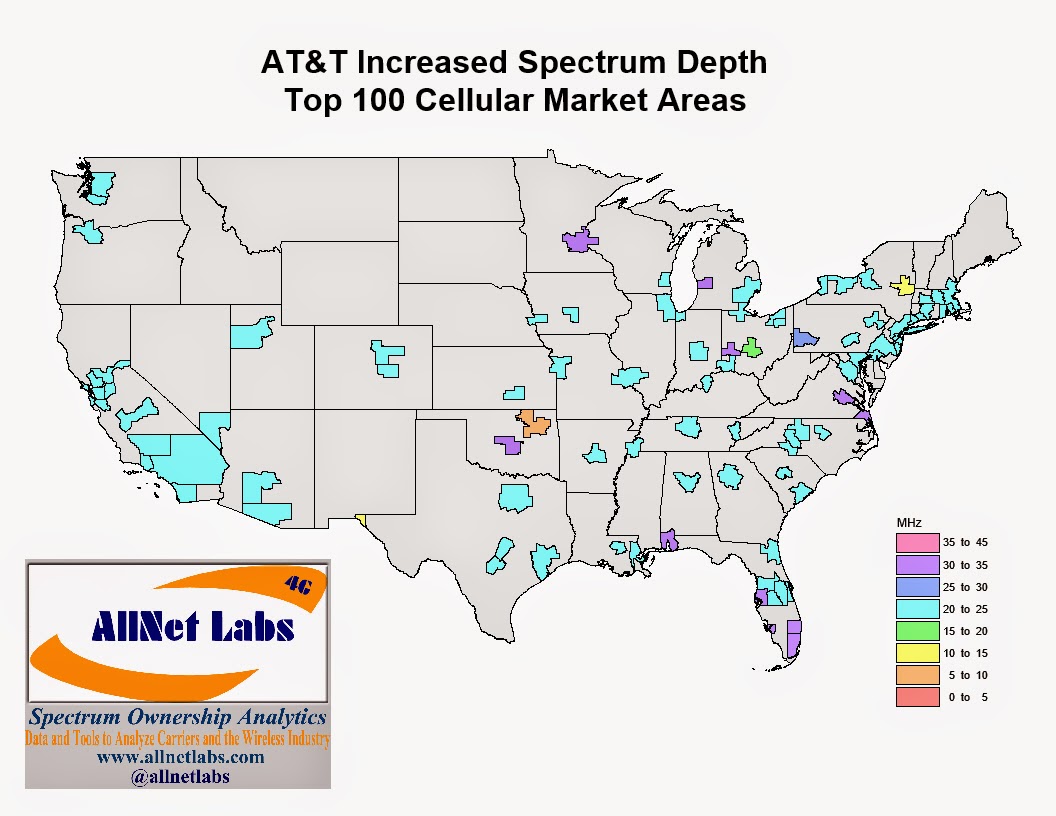
So how can your company stay on top of the changes that may affect your markets. Allnet Insights' publishes a National Carrier Spectrum Depth Report which details the spectrum held by Verizon, AT&T, T-Mobile, Sprint, Dish, and USCellular in the Top 100 Cellular Market Areas (CMA). We report both the spectrum that each carrier currently holds (Current Holdings) and the spectrum they will hold in the future (Future Holdings) based on pending FCC transactions. Reporting on both current and future holdings enables Allnet Insights' to also report on the changes between current and future holdings which highlight the location and quantity of spectrum that is changing hands.
Below is a screenshot of the 11th through the 25th most populated CMA markets in our February 2017 report. This highlights the markets where the national carriers are either increasing or decreasing their spectrum holdings. In the Excel report you can reveal specific holdings by frequency bands that are changing but for this post, we will stay with the total spectrum view. From this view, you can see that in San Diego, T-Mobile is increasing their held spectrum by 5MHz while AT&T is decreasing their held spectrum by 5MHz. The reverse is happening in the Sacramento CMA.

We also highlight the spectrum that is changing hands in our Web Spectrum Viewer. In the Spectrum Grid menu, we lower case the 3 letter carrier code to indicate that the carrier ownership is changing from the current to the future. Looking at the same San Diego market (San Diego County) you can see (tmo) on the PCS B6 spectrum. Since this screen shot is of the Future Holdings, T-Mobile is will control this spectrum in the future.
Future:

The screen shot below is of the San Diego County Current Holdings. (att) in the PCS B6 column indicates that AT&T is the current operator of the B6 channel.
Current:

For Sacramento (Placer, Sacramento, and Yolo Counties), we can see that AT&T will be the future operator of the PCS B11 channel and that T-Mobile will be the carrier giving up the PCS B11 channel.
Future:

Current:

My last example is in Tucson, AZ. From the National Carriers Report we can see that T-Mobile is increasing their held spectrum by 10MHz.

From the Web Spectrum Viewer, it is clear that T-Mobile is receiving the PCS A10 and A11 channels from Commnet (cmm).
Future:

Current:

Today, we have released Allnet's Insights' March 2017 Mobile Carrier - Spectrum Ownership Analysis Tool. Below are the transactions that have been updated by the FCC from February 1st to February 28th and are included in our update.
The details for all of the below transactions are available by subscribing to Allnet Insights' Web Tool - Basic Module. Our Web Tool provides spectrum transaction detail, a spectrum grid of spectrum owners at a county level, and spectrum database covering all mobile carrier frequencies from 600MHz to 2.5 GHz.
Granted Assignments (Assigning Ownership from Assignor to Assignee):


Granted Leases (Leased to Assignee from Assignor):


New Pending Assignments (Assigning Ownership from Assignor to Assignee):

Pending Leases (Leased to Assignee from Assignor):

Today, we have released Allnet's Insights' January 2017 Mobile Carrier - Spectrum Ownership Analysis Tool. Below are the transactions that have been updated by the FCC from December 1 to December 31 and are included in our update.
The details for all of the below transactions are available by subscribing to Allnet Insights' Web Tool - Basic Module. Our Web Tool provides spectrum transaction detail, a spectrum grid of spectrum owners at a county level, and spectrum database covering all mobile carrier frequencies from 700MHz to 2.5 GHz.
Granted Assignments (Assigning Ownership from Assignor to Assignee):


Granted Leases (Leased to Assignee from Assignor):

New Pending Assignments (Assigning Ownership from Assignor to Assignee):

Pending Leases (Leased to Assignee from Assignor):

In this blog post I am going to explore how Sprint can configure their PCS spectrum for LTE using Allnet Insights' Mobile Carrier Spectrum Ownership Analysis Tool. As a review Sprint's initial LTE deployment utilized a 5 MHz PCS G Block channel. In the map below I have determined the maximum channel size for spectrum that is contiguous with Sprint's initial LTE channel. In Seattle, Sprint can expand their initial channel to a 10MHz LTE channel while in Las Vegas Sprint can expand their initial channel to a 20MHz channel.

Looking at the Las Vegas market area with Allnet Insights' Spectrum Grid Module, you can see the specific channels Sprint controls in each county. For Clark County, Sprint controls all of the C block channels along with the G block. Unfortunately for Sprint, they can't use the entire 20MHz for LTE since they still need PCS spectrum for their CDMA voice service. In Esmeralda County Sprint has 15MHz of spectrum including the G block that should be configured for LTE with 10MHz of the A block channels available for CDMA voice.

The map below details the largest channel size of PCS spectrum that Sprint controls aside from the spectrum contiguous with the G block. This is the spectrum that can be shared with CDMA voice and could also be deployed in Sprint's FDD-LTE carrier aggregation scheme.
In an earlier post, I discussed the ability for Sprint to utilize the Mid-Band Segment of their 2.5GHz spectrum band for LTE. Previously, I had compiled from FCC filings, the BTA markets where video (the original service licensed in the 2.5 GHz band) is still operating. Since the April 2016 post, Allnet Insights' has investigated below the BTA market level to determine the specific licenses that are still broadcasting video. This can be seen in Allnet Insights' Web Spectrum Viewer, in the Spectrum Grid menu.
In the Web Spectrum Viewer, we use the MVU code instead of a typical carrier code (e.g. VZW, SPR, TMO, or ATT) to designate the licenses that are still broadcasting video. In the Los Angeles CMA market, video is operating on all of the mid-band channels (A4, B4, C4, D4, F4, and E4) for both Los Angeles county, and Orange county. Sprint can utilize the entire MBS for LTE in the Riverside and San Bernardino counties.
Los Angeles CMA:

In the Chicago CMA the G4 channel is used in all 6 counties and the E4 channel is used for video in 3 counties.
Chicago CMA:

In the New York CMA, the D4 channel and G4 channel are available for LTE deployment across all but one county in the New York CMA, but the other channels are largely unavailable in the New York CMA.
New York CMA:

What is important to Sprint is the size of the LTE channel or channels that they can create using the Mid-band channels. Using the data from Allnet Insights' Spectrum Grid, we total the number of contiguous channels, rounding to the 3GPP LTE channel sizes of 5, 10, 15, and 20 MHz. The map below displays the total MHz of the LTE channels that Sprint can create in the Mid-band for each county.

With this blog post, we are highlighting the Change in Spectrum Holdings feature of our National Carriers - Spectrum Holdings reports. In this report, we detail the spectrum holdings for each of the national carriers, including Dish, and USCellular. The first segment of the report details each carrier's future holdings, tracking the effects of all pending FCC transactions. The second segment of the report details each carrier's current spectrum holdings. Using each of these segments, we provide a Change in Spectrum Holdings segment which highlights the CMA markets where a carrier's spectrum holding are increasing (+) or decreasing (-) because of filed FCC transactions.

In the view above, from August 2016, you can see the summary details for the spectrum additions and subtractions for each of the national wireless carriers. This view highlights a spectrum trade between Sprint and T-Mobile in the Cleveland market (5 MHz) as well as the T-Mobile's pending 700MHz A-Block transactions.
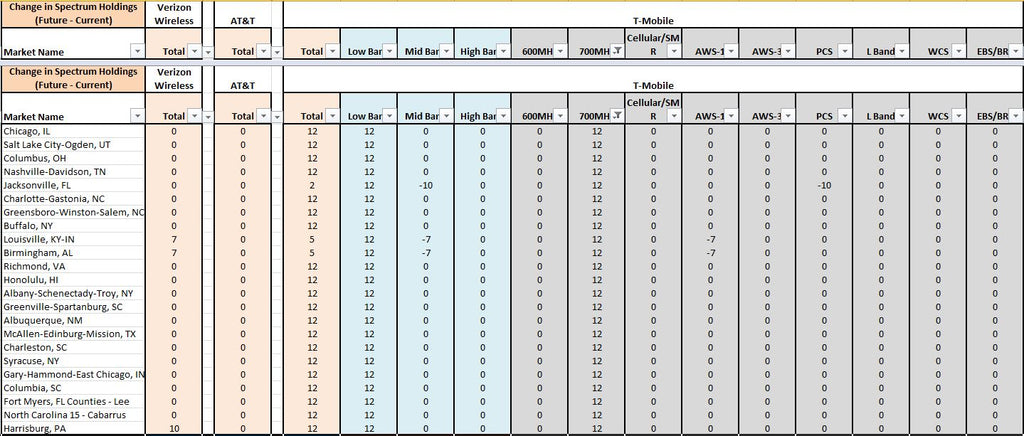
The view above details the band classifications (low, mid, or high) and the frequency band that contribute to T-Mobile's 12 MHz increase in spectrum. The August 2016 report concludes that the transactions for all of the listed market names are still pending.
Now looking at the September 2016, the Allnet's Spectrum Ownership Analysis Tool has updated the transactions that were consummated during August 2016. The only pending 700MHz - A Block transaction is T-Mobile's purchase of Laser in Chicago, IL.
For the cost of a monthly subscription to the National Carrier - Spectrum Depth Reports ($495/mo), the monthly effect of pending and closed transaction can be seen and evaluated.
For this edition of "How Does Our Data Compare?" we are illustrating how our data compares to a Spectrum Chart that Sprint shared with Fierce Wireless at CTIA 2016. What Sprint is illustrating each of the national carriers average spectrum holdings in each in each frequency band. 
We arrive at the Nationwide average by applying a population-weighted average to our spectrum data that is aggregated at a county-level. As you can see, we hit each carriers spectrum depth exactly except for Sprint's EBS/BRS data which we only miss by 2 MHz. With our October 2016 Version of our Mobile Carrier - Spectrum Ownership Analysis Tool, we are including the ability to chart eight carriers, detailing the average spectrum holdings either by Frequency Band or Band Classification. You can conduct side by side analysis for nearly 1900 US Wireless Carriers. In the chart below you can see the National Averages for spectrum held by the FCC. This total details the AWS-3 and 600 MHz spectrum that will be auctioned by the FCC.

Our National Spectrum by Band Classification chart combines the values for each of the frequency bands into the Low, Mid, or High Band Classifications.

In addition to the National Spectrum values and charts, Allnet's Mobile Carrier - Spectrum Ownership Analysis Tool provides market-level (CMA, EA, PEA), state-level, and county-level reports for 8 carriers side by side.
Recently Allnet Insights compiled the video broadcasting status for the mid-band 2.5 GHz spectrum for every US BTA. The map below indicates whether Sprint will be able to utilize the mid-band channels in particular markets. In the red Base Trading Area (BTA) markets below, Sprint is restricted from utilizing the channels in the mid-band segment (MBS) because high power video operations remain on channels within this band. This restricts access to 42 MHz of the 188 MHz of spectrum available in the EBS/BRS (2.5 GHz) spectrum. In many markets, Sprint owns or leases nearly 160 MHz of this spectrum. So including these restrictions, effectively reduce Sprint's usable spectrum holdings to 120 MHz in these markets. Video operations limit Sprint's spectrum in all of the Top 20 markets except Seattle. The video operators in each of these markets have broadcasting sites and receiving antennas distributed schools and churches through out the broadcasting cities.

Recall that the entire 2.5 GHz spectrum band previous to 2006 was utilized for video broadcasts, either wireless cable or educational video broadcasts. As Clearwire began to utilize this band, they moved the remaining video broadcasters to the mid-band. Below you can see how a licensee with the A1, A2, A3, and A4 channels would receive 3 - 5.5MHz channels in the low band segment (LBS) which would be used for LTE while the A4 channel would be shifted to the mid-band segment as a 6 MHz channel. A licensee with the G1, G2, G3, and G4 channels would receive 3 - 5.5MHz channels in the UBS (upper band segment) and the G4 channel would be shifted to the mid-band segment again as a 6 MHz channel.


These graphs detail the peak capacity for downlink files and streaming video for the four major national wireless carriers plus Dish and USCellular. They illustrate the peak capacity on a market-by-market basis. In creating the graphs, I anticipate the usage of each wireless carrier’s total spectrum available, not just the spectrum they have dedicated to LTE at this time. These graphs allow you to see the significant capacity advantage that Sprint will have once they deploy their 2.5GHz spectrum. They also provide a market-by-market comparison of AT&T and Verizon capacity. You can see that AT&T has a capacity advantage versus Verizon in all Top 20 markets except Minneapolis-St. Paul. In addition, you can see the relatively low capacity that T-Mobile is able to offer and the capacity that Dish could provide after they launch a network.
I was able to construct these graphs by using Allnet Insights and Analytics Spectrum Ownership Analysis Tool determine the number of LTE channels that each carrier’s spectrum can support.
Assuming that each LTE channel had the follow achievable LTE Peak Data Rates:

These rates were applied to each of the carriers LTE channels to create a total peak downlink throughput. For all EBS/BRS spectrum (Sprint’s 2.5GHz spectrum), I assumed TDD (Time Division Duplex) LTE operation and each channel’s throughput was reduced to 75% to reflect the 75:25 downlink to uplink ratio for TDD operation. TDD LTE utilizes a single radio channel to both transmit to the mobile device (downlink) and transmit from the mobile device (uplink). In TDD LTE timeslots, similar to the wedges on the Wheel of Fortune, carry either downlink traffic or uplink traffic during that time interval. Since internet traffic is typically 75% downlink and 25% uplink, US operators dedicate 75% of the wedges to downlink and 25% to uplink. Most US spectrum bands are configured for FDD (Frequency Division Duplex) LTE, which utilizes two radio channels, one to transmit to the mobile device (downlink), and one to transmit from the mobile device (uplink).