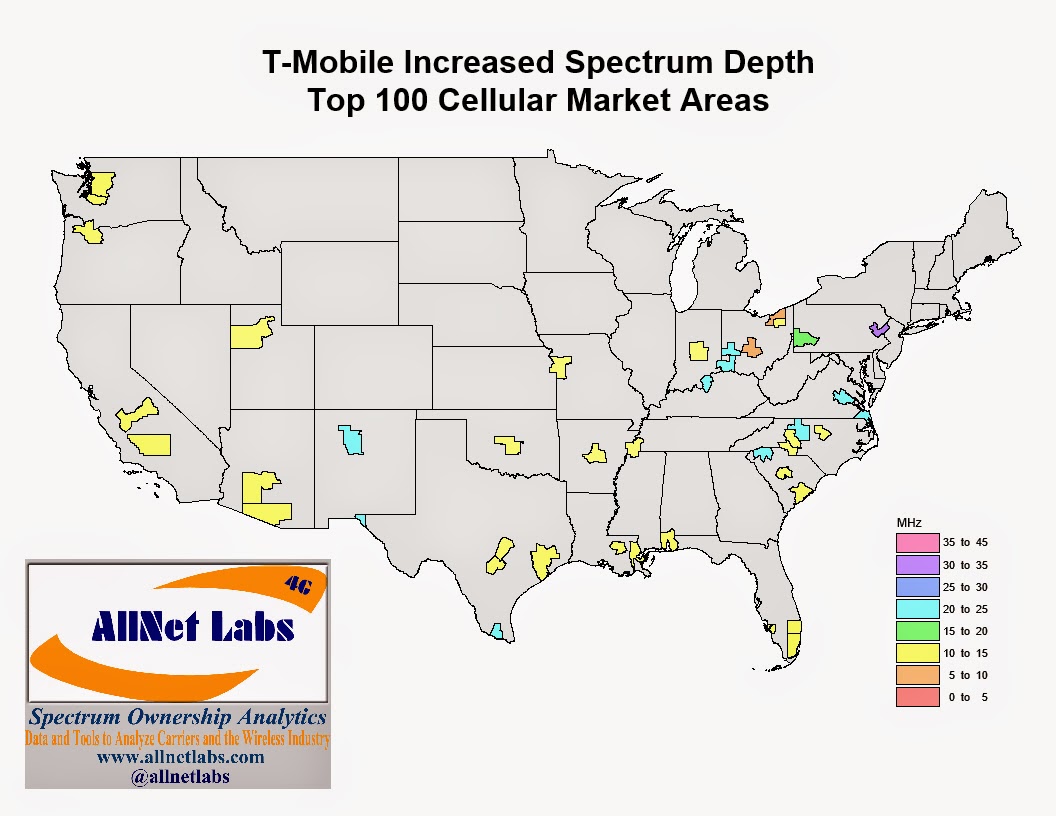
For the next four days we will be posting a map each day for one of the national spectrum holders that indicates the amount of spectrum they are adding to their spectrum holdings in the Top 100 Cellular Market Areas. The primary source of the additions on these maps are the AWS-3 spectrum licenses although other proposed (FCC filed) transactions are included. For T-Mobile below, the additional spectrum depth in Seattle, Tacoma, and Portland relates to a 700MHz A-block acquisition from Vulcan while the Pittsburgh market reflects both a 700MHz A-block acquisition (from McBride) and a AWS-3 H block acquisition via the auction.
In the charts below, we present the current carrier aggregation plans for AT&T, Verizon, USCellular, Dish, T-Mobile, and Sprint. Green indicates that particular frequency block is used one time in the aggregation scheme. Yellow indicates that particular frequency block is used twice in the aggregation scheme. For both the green and yellow highlights, only one carrier can be utilized in each frequency block. The blue highlights indicate that multiple carriers can be utilized in each frequency block (non contiguous).
AT&T
Verizon

T-Mobile
Sprint
Dish
US Cellular
AllNet's Spectrum Ownership Analysis Tool has been updated to include all of the AWS-3 auction results in all of its Analysis Modules. Below in the Spectrum Grid Module, you can see which carrier acquired the spectrum rights for each of the uplink channels in the Top 5 CMA markets.
The screenshot of the downlink channels also provides a view into where Dish's AWS-4 spectrum fits with their new AWS-3 spectrum.
Yesterday, the FCC approved a Channel 51 transition in Dayton, OH. The movement of this TV station from Channel 51 to Channel 18, will eliminate the adjacent channel interference risk to T-Mobile's 700MHz A-Block spectrum in Denver. Below is a listing of the currently filed Channel 51 transitions. The Dayton, OH transition is linked to the FCC filings. The previous filings are linked in previous postings. Previous postings can be accessed the the Channel 51 label.
Our Spectrum Ownership Analysis Tool has incorporated the Channel 51 interference issue into our Spectrum Grid module. From this module, you can see the 700MHz A-Block owner and an indication of whether Channel 51 is licensed in that particular county. Green highlights over the Channel 51 callsign indicate that a transition plan has been approved, yellow highlights indicate that a transition plan has been filed, and red highlights indicate the markets where interference issues will persist.

Yesterday, the FCC approved a Channel 51 transition in Denver, CO. The movement of this TV station from Channel 51 to Channel 26, will eliminate the adjacent channel interference risk to T-Mobile's 700MHz A-Block spectrum in Denver. Below is a listing of the currently filed Channel 51 transitions. Each of the Daily Digest dates is linked to the filed information.
| Final Daily Digest | Initial Daily Digest | Market
| Call Sign | Current Channel | Proposed Channel |
| 12/13/2013 | Oklahoma City, OK | KSBI(TV) | 51 | 23 |
| 9/4/2014 | Rome, GA | WPXA(TV) | 51 | 31 |
| 9/4/2014 | Kansas City, MO | KPXE-TV | 51 | 30 |
| 9/18/2014 | Dayton, OH | WKEF(TV) | 51 | 18 |
| 12/16/2014 | 10/17/2014 | Denver, CO | KCEC(TV) | 51 | 26 |
| 12/8/2014 | Longview, TX | KCEB | 51 | 26 |
Our Spectrum Ownership Analysis Tool has incorporated the Channel 51 interference issue into our Spectrum Grid module. From this module, you can see the 700MHz A-Block owner and an indication of whether Channel 51 is licensed in that particular county. Green highlights over the Channel 51 callsign indicate that a transition plan has been approved, yellow highlights indicate that a transition plan has been filed, and red highlights indicate the markets where interference issues will persist.
The November 2014 Spectrum Ownership Analysis Tool includes several enhancements to the Market Level Reports.
Market Level Reports are available for Cellular Market Areas
(CMA) and Economic Areas
(EA). Initially these market level reports only included spectrum depth values for each carrier by spectrum band. With this update, you can see each selected carrier's
total spectrum holdings, their spectrum
holdings in each of the
primary band classes (
Low Band,
Mid Band, and
High Band), and their spectrum
holdings in each
spectrum band.
The band classes are defined as follows:
- Low Band
- Mid Band
- L Band/S Band (AWS-4)
- AWS-1
- PCS
- AWS -3 (when the auction is complete)
- High Band
The user can select 8 carriers to be displayed in these reports from the 580 carriers available in the Spectrum Ownership Analysis Tool. For the examples below, we have included most of the national wireless carriers as well as a few regional carriers.
The spectrum depth values for each of these reports are determined from the county-level spectrum ownership information in the Spectrum Ownership Analysis Tool using a population-weighted average. This means that each of the county-level spectrum depth values is multiplied by a ratio of the county's population divided by the market population. This provides for a higher weighting for spectrum depth in higher population counties.
CMA Market Report - Total Spectrum Depth and Spectrum Depth by Band Class
CMA Market Report - Spectrum Depth by Frequency Band
In support of the upcoming auctions we have included the available AWS3 channels in our Spectrum Grid worksheet and we have added both a CMA and EA Market Report.
In the Spectrum Grid you can see the primary spectrum owner for any spectrum band, including the adjacent AWS1 band, at a county level. The CMA Market Report displays the spectrum holdings for 8 selected carriers utilizing the Cellular Market Area (CMA) geographic boundaries. The EA Market Report displays the spectrum holdings for 8 selected carriers utilizing the Economica Area (EA) geographic boundaries. For both of these reports, AllNet's county-level data is population weighted averaged to either the CMA or EA markets.
Spectrum Grid (AWS3 Portion)
CMA Market Report
EA Market Report
Here is the first channel sharing agreement where spectrum will be sold back to the FCC as part of the 600MHz Broadcast Incentive Auction.
Los Angeles KCET/KLCSIt is interesting to note that neither of the stations involved is operating a for profit business. KCET indicates that 2 million Southern Californians watch weekly. Their broadcast footprint covers over 17 million people in Los Angeles, Orange, Riverside, San Bernardino, Ventura, Kern, and San Diego counties. KLCS is a non-commercial educational channel directly supporting the 700,000 students within the Los Angeles Unified School District. Both broadcasters are on the major cable, Dish, and DirecTV line ups.
For over the air broadcasts, one of these broadcasters will need to become the secondary video channel. Since KLCS has a closed subscriber base, LA Schools, I think they are the ideal candidate for the secondary video channel.
With the transition to Digital TV in 2009, broadcasters utilized the new digital technology to place multiple video streams within the reallocated 6MHz channel. With an aerial antenna, your TV would see the primary video broadcast as 5.001 with the secondary broadcast as 5.002. Few secondary broadcast channels make it onto the cable TV, Dish, or DirecTV line ups.
Link to Filing
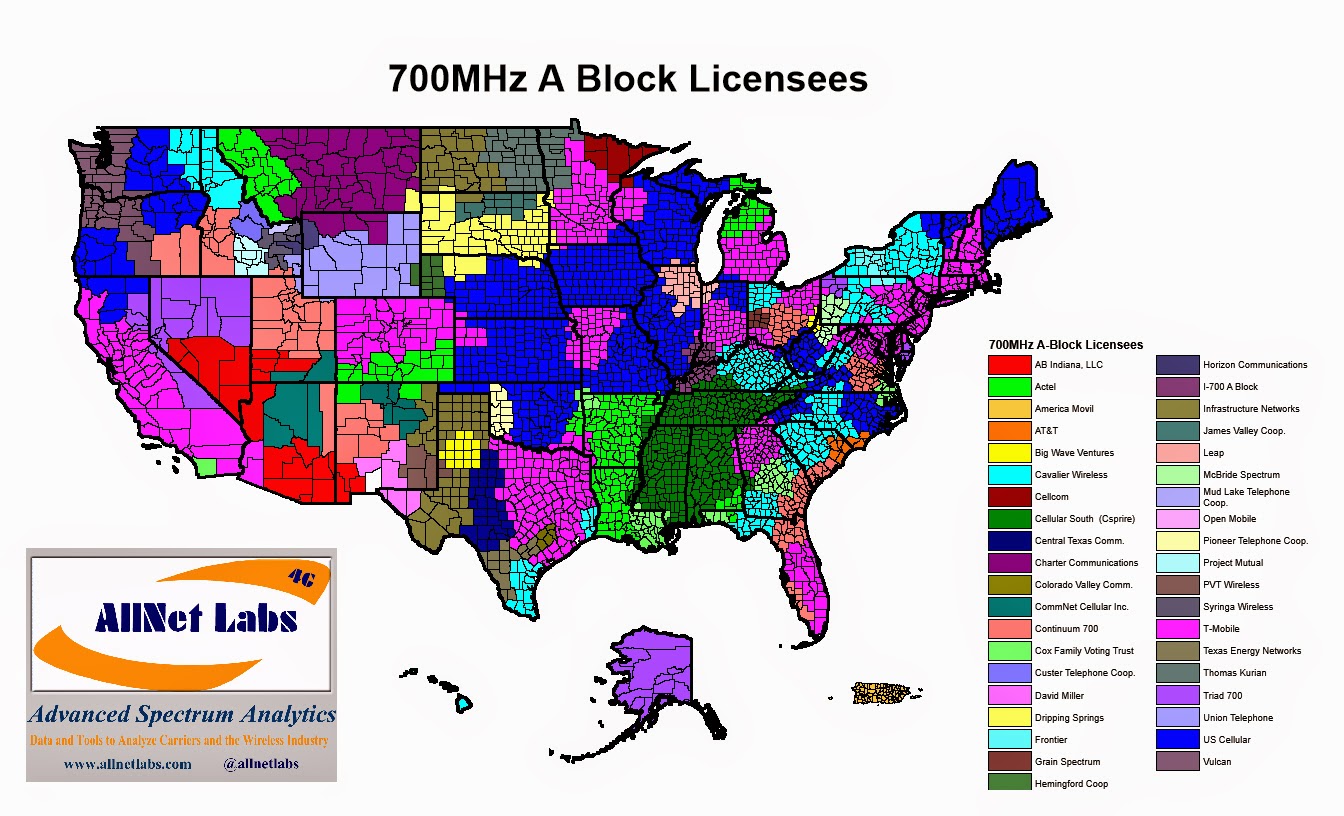
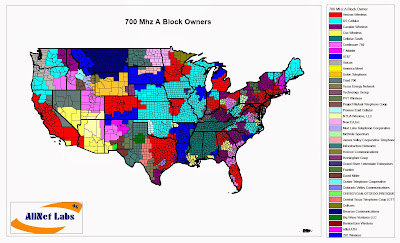
AllNet Labs is now producing research reports on topics that have a broad interest with customers through out wireless industry. These reports will typical contain maps to provide a geographical view on an issues as well as tabular analysis data. Our first report focuses on the 700MHz A Block spectrum owners. Later this week we will release a report on the Band 17 and 29 spectrum (700MHz B,C,D, and E Blocks) which AT&T has in their deployment plans.
T-Mobile 700MHz A Block - Research Report
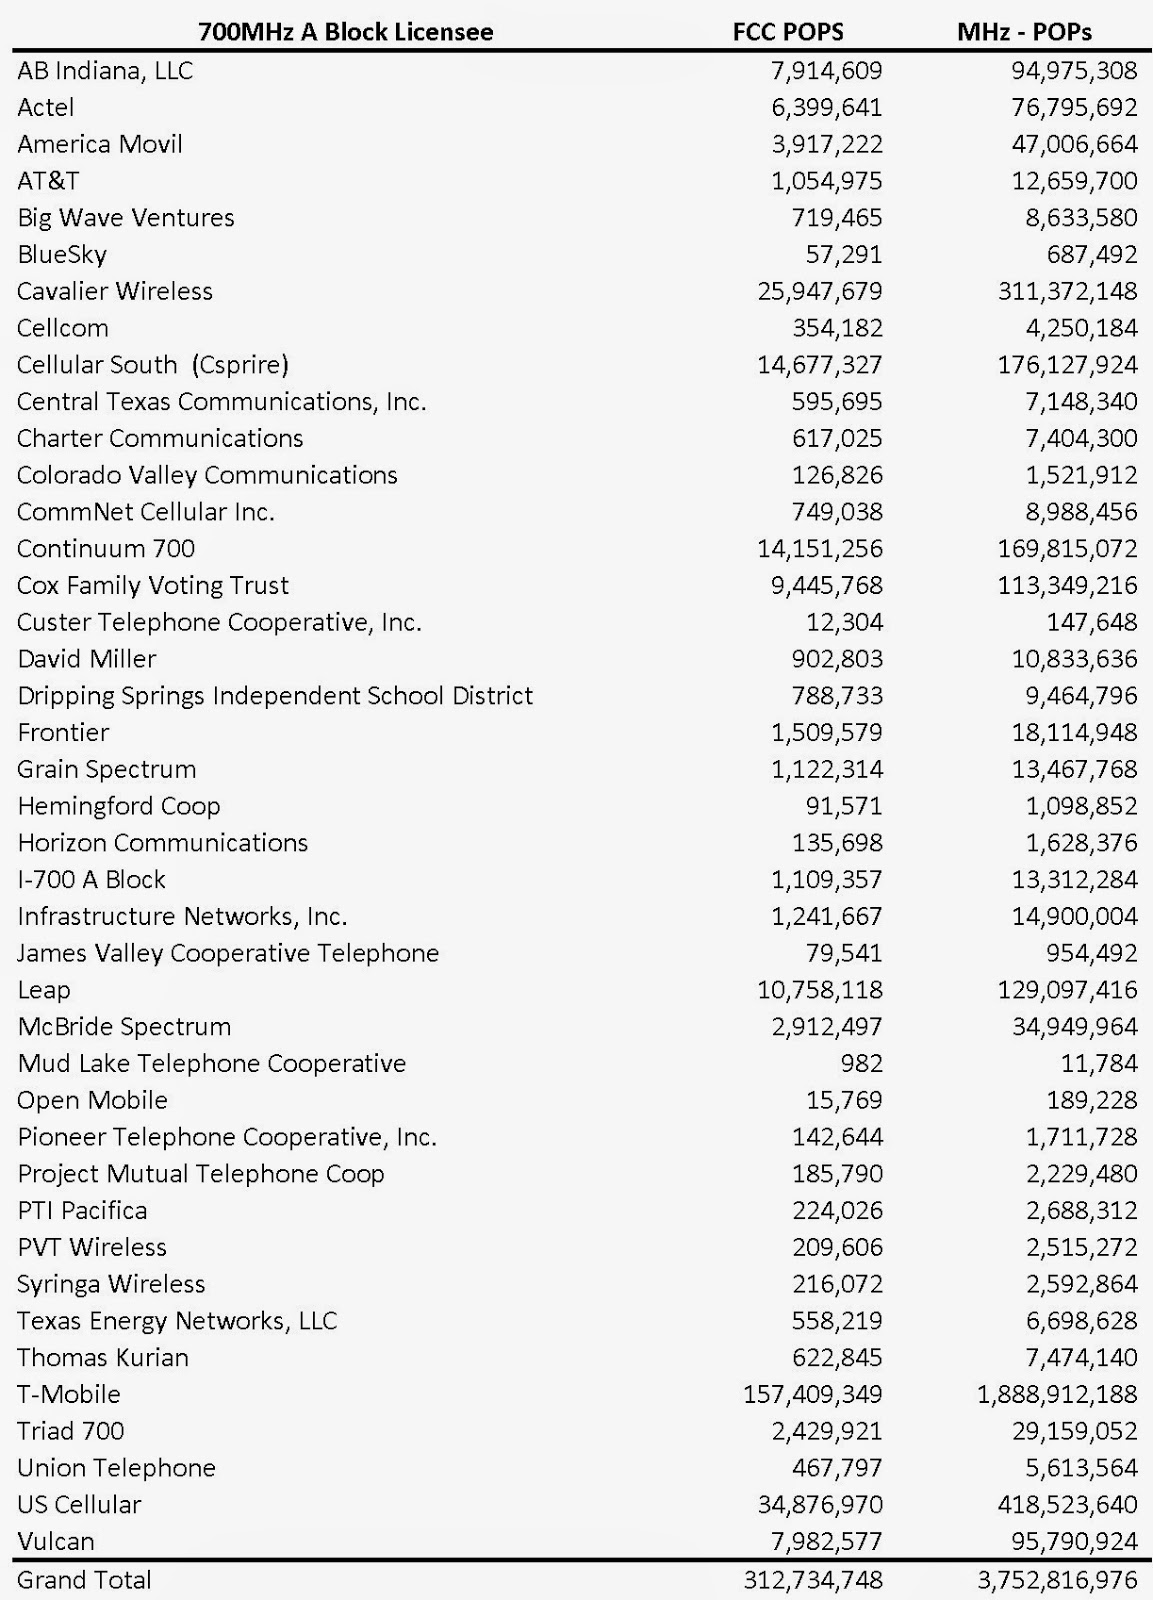
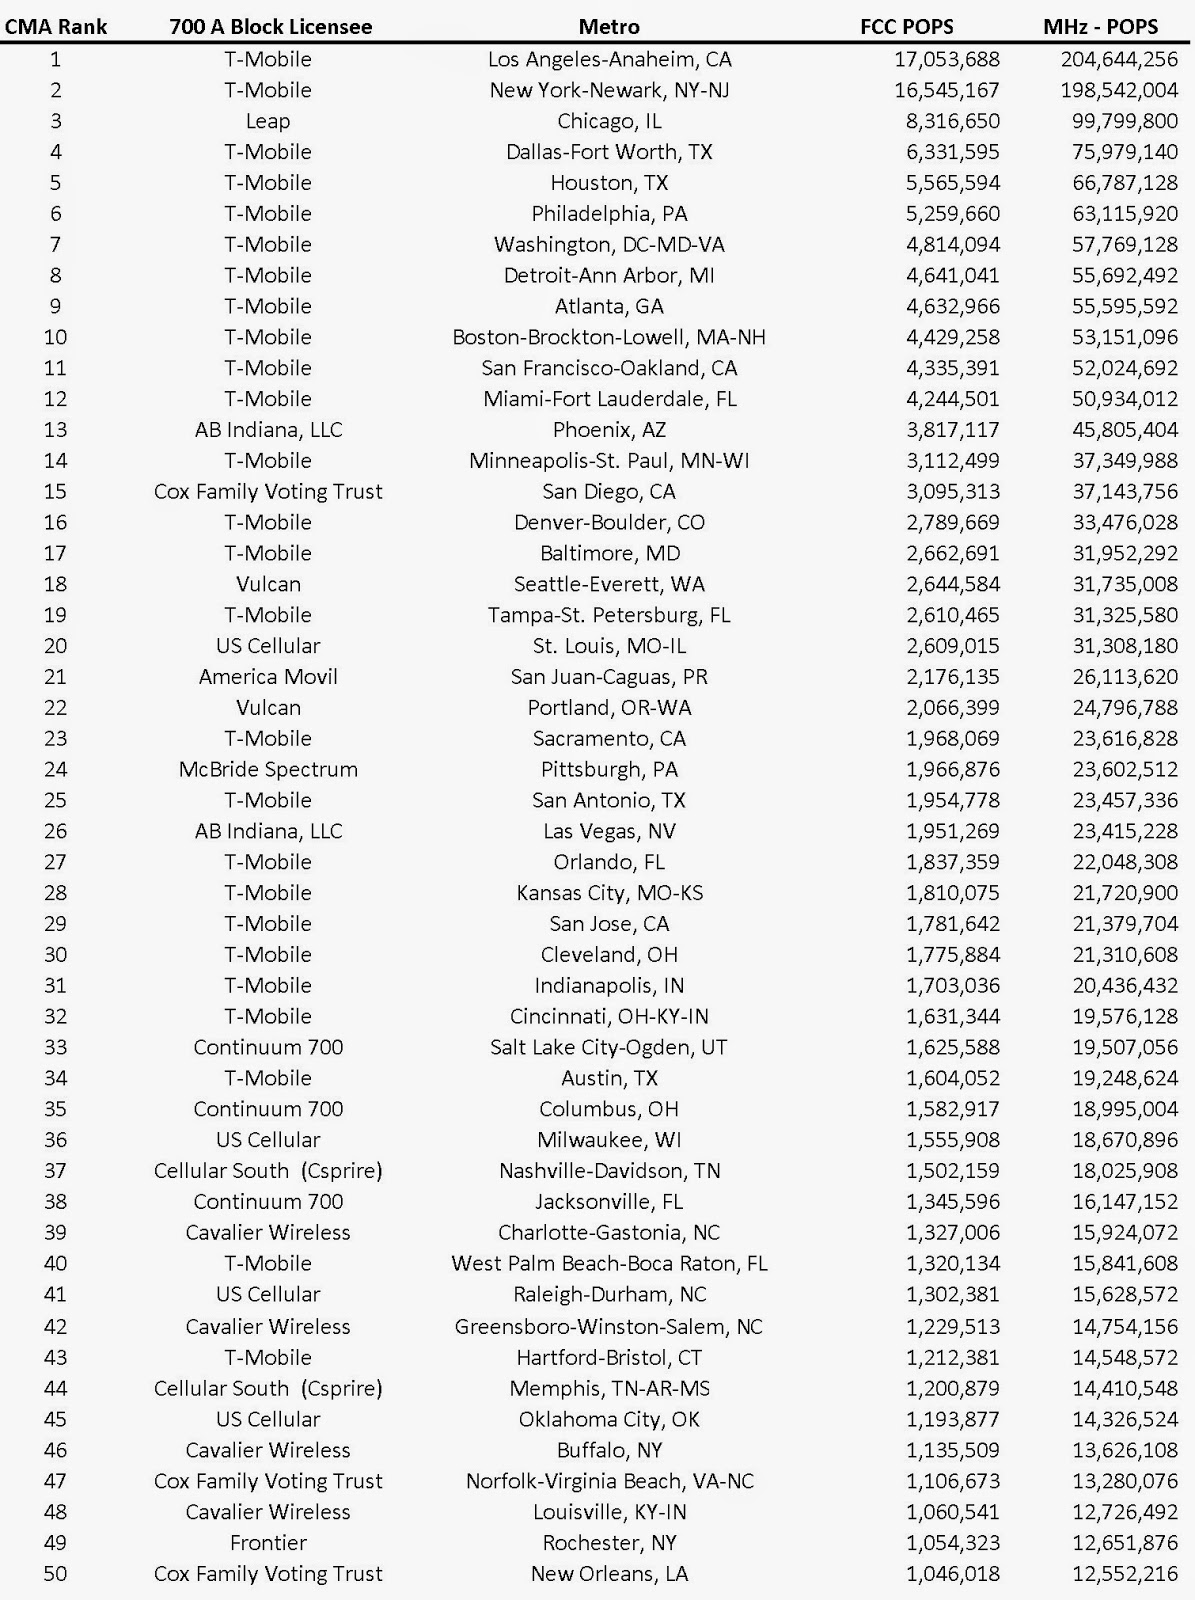
This research report evaluates T-Mobile's ownership of the 700MHz A-Block. T-Mobile is the primary owner of the licenses for this band for a majority of the US population. This report provides a map detailing the geographies where T-Mobile is licensed as well as the geographies licensed to other carriers. This report also details the spectrum depth (MHz) and MHz-POPS (relative spectrum valuation) for each of the 700MHz A-Block licensees. Last, the Top 50 markets are evaluated to determine which licensee controls each of these critical markets.
The report includes:
Licensee Holdings Summary Table
Top 50 Markets by Licensee
For the rest of this week, Spektrum Metrics Labs is discounting each of its National Carrier Reports to $199 (regular $495). To receive this discount, enter discount code 8U1NXU4PCYNM during your check out process. Selecting the report name below will take you to our store where you can add the report to your cart.
July's National Carrier Reports highlight the effects of recent spectrum transactions including Verizon's purchase of Cincinnati Bell, AT&T's purchase of Sprint's WCS spectrum, as well as many smaller transactions filed prior to 7/1/2014.
The National Carrier reports reduce the time and money spent researching the effects of hundreds of FCC transactions on the National Wireless Carriers (Verizon, AT&T, Sprint, and T-Mobile). The National Carrier reports provide monthly visibility to each national carrier's Spectrum Holdings, available LTE Channels, and Peak Downlink Throughput for the 100 most populated markets (Cellular Market Areas) in the United States. The National Carrier reports are delivered as Excel workbooks showing both summary information for each carrier as well as spectrum band details.
Spectrum Holdings Report - Top 100 Cellular Market Areas
LTE Channels Report - Top 100 Cellular Market Areas
Peak Downlink Throughput - Top 100 Cellular Market Areas
The news yesterday that T-Mobile and Sprint are forming a Joint Venture to buy 600MHz Broadcast Incentive Auction spectrum shows a shift in the way that both Sprint and T-Mobile look at the places that aren't in non-Top 100 markets, along Interstates, or along US Highway routes.
Will the T-Mobile/Sprint JV use this low band spectrum to fill out the areas that they rely on partners (primarly AT&T and Sprint) to provide their coverage? Virtually all of T-Mobile's recently acquired 700MHz A band spectrum is in large cities (see my post from 11/2013) and Sprint has been reluctant to add towers in rural areas to utilized the 7MHz of low band SMR spectrum that they are using elsewhere for their Spark service.
Sprint's Current Coverage
T-Mobile Coverage (Light Pink indicates Partner Coverage)
T-Mobile has signaled with the FCC that they are concerned about reasonable roaming rates and Sprint is clearly in the same position with Verizon, needing Verizon's coverage to offer true nationwide coverage. On the other side of the coin, T-Mobile indicates that they already cover 96% of the US population, leaving about 12.5 million POPs to be covered with this new low band spectrum.
For both T-Mobile and Sprint a build out in these uncovered areas would reduce their risk of of significant rate increases or roaming service elimination with Verizon and AT&T, but these towers would be much less efficient than towers elsewhere in their collective networks. Obviously they would share the deployment costs and operating cost, but with these towers would have serve a low number of POPS (population)/Tower which is a standard industry metric on capital efficiency for deployed towers.
How would this affect Sprint's recent regional partners?Sprint Regional PartnersBuilding out this spectrum would put Sprint in direct competition with these recent formed partners. These regional partners may also participate in the auction acquiring more spectrum. Each of these partners only needs low band spectrum for wide area coverage, and there are ample amounts of mid-band (PCS/AWS) spectrum in these areas for these regional partners to uses as capacity grows.
The first place to start on the rumored Sprint / T-Mobile merger/acquisition is to look at the merged entity's total spectrum holdings. AllNet Lab's Spectrum Analysis Tool with June 2014 FCC data was used for this analysis. The Spectrum Analysis Tool is available at www.allnetlabs.com along with National Carrier Spectrum Holding and LTE Channel reports. In the map below, you can see the counties where the the spectrum held will exceed the spectrum screen (Orange) or will greatly exceed the spectrum screen (Red). In addition, you can see that in some counties the merged entity will have up to 374MHz of spectrum.

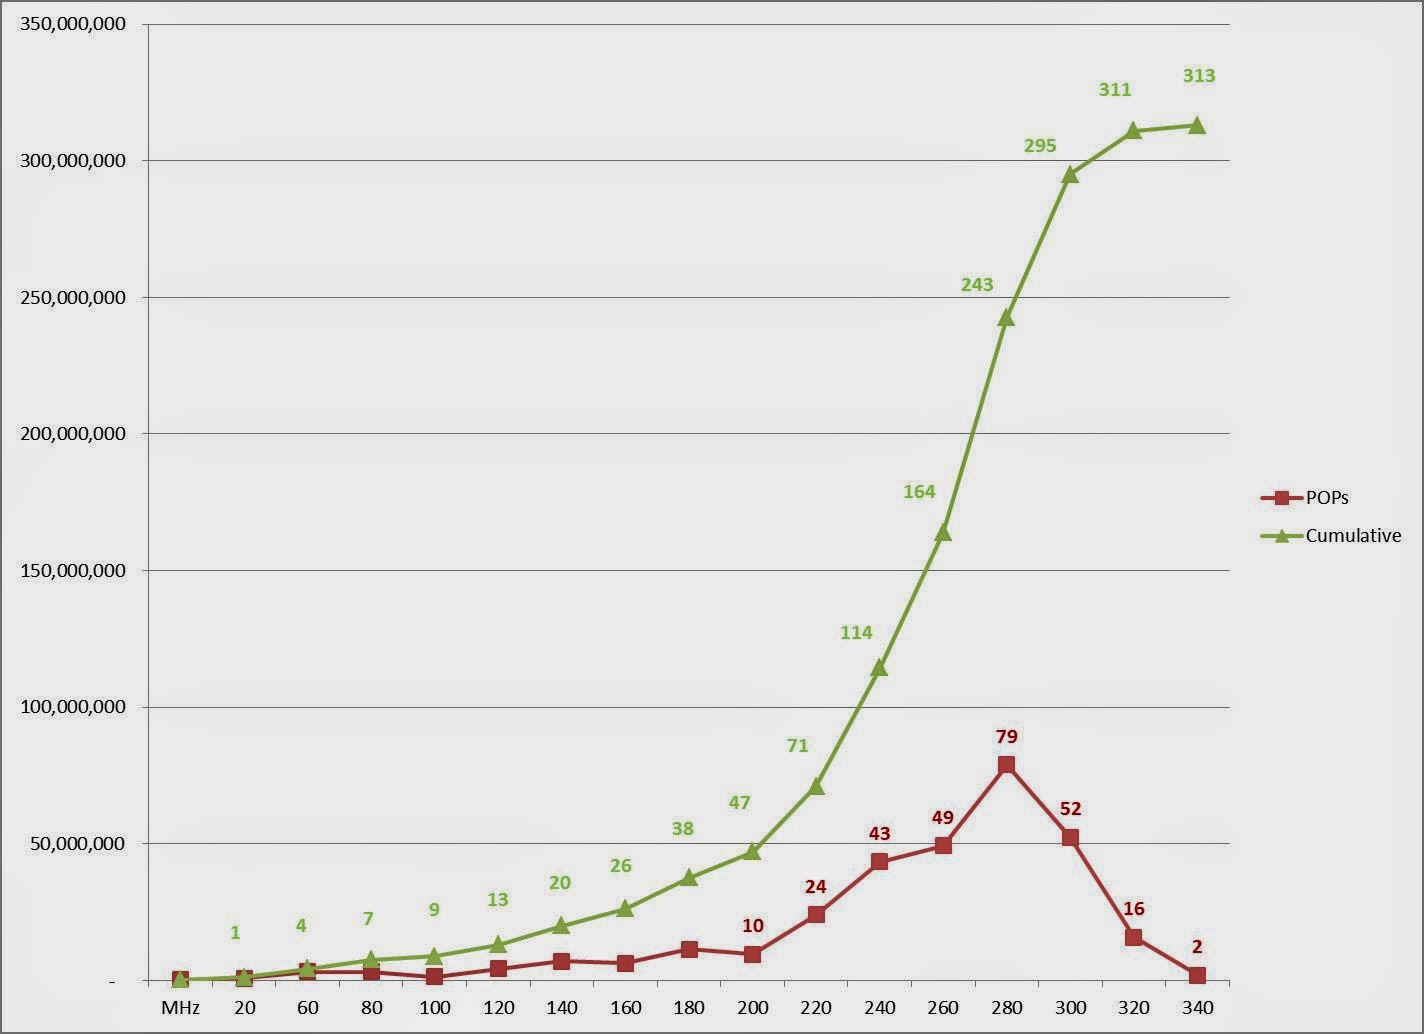
To see how this spectrum depth relates to the population that the licenses cover, we created a histogram evaluating the population covered by different spectrum depths. The red line below indicates the sum of population in areas with similar spectrum depth. For example, there are 10 million people in areas where Sprint/T-Mobile has 200MHz of spectrum and 79 million people in areas where Sprint/T-Mobile have 280MHz of spectrum.
The green line indicates the sum of the population as you increase the range from left to right. For example, there are 1 million people in areas where Sprint/T-Mobile have 20MHz or less spectrum. Considering a 195MHz spectrum screen, you can see that only 47 million people live in areas where Sprint/T-Mobile will be below the spectrum screen, thus Sprint/T-Mobile exceeds the spectrum screen over 85% of the US population.
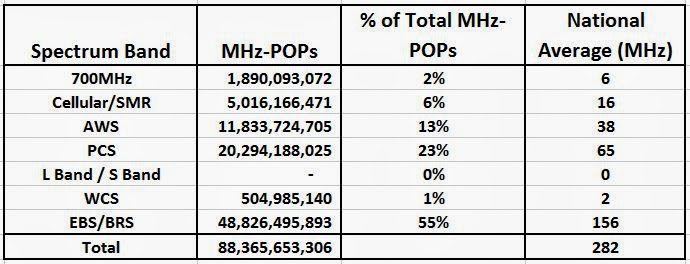
Our last analysis summarizes the MHz-POPs for Sprint/T-Mobile by spectrum band. WCS spectrum is listed but it is being transferred to AT&T. Sprint's EBS/BRS spectrum still accounts for 55% of the combined entities MHz-POPs although the combined AWS and PCS spectrum represents 36%. Using the MHz-POPs values, we can develop a National Average of Sprint/T-Mobile's spectrum holdings. Looking again at the AWS and PCS spectrum holdings, Sprint/T-Mobile would average 38MHz of AWS spectrum and 65MHz of PCS spectrum across the country.
AllNet Lab's Spectrum Analysis Tool is an Excel based product which allows users to visualize and analyze the current spectrum ownership for all of the mobile carrier and satellite frequency bands at a county level for all 50 states and US territories. The Spectrum Analysis Tool includes 15 color-coded spectrum holders and over 600 additional identified carriers.
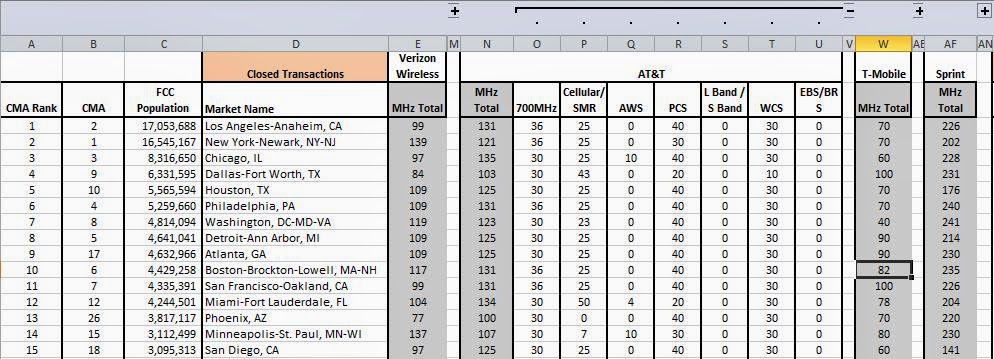
AllNet Labs is now offering a monthly spectrum report summarizing the LTE Channels for the National Carriers (Verizon, AT&T, Sprint, and T-Mobile). To develop this report, AllNet Labs takes the spectrum outputs at a county level from its Spectrum Analysis Tool and applies a county population weighting before averaging all of the counties within a Cellular Market Area (CMA). Data is available for all 733 CMA markets, but the standard report is formatted for the 100 most populated CMA markets. This report is delivered as an Excel spreadsheet, with both summary and detailed views. In the summary view (Figure 1), only the size and quantity of LTE channels for each carrier are displayed. This report evaluates each carrier’s complete spectrum holdings to determine the size and quantity of available LTE channels. The report also assumes that the largest channel would be utilized rather than multiple smaller channels (e.g. a 20MHz channel is assumed rather than 2 – 10MHz channels).
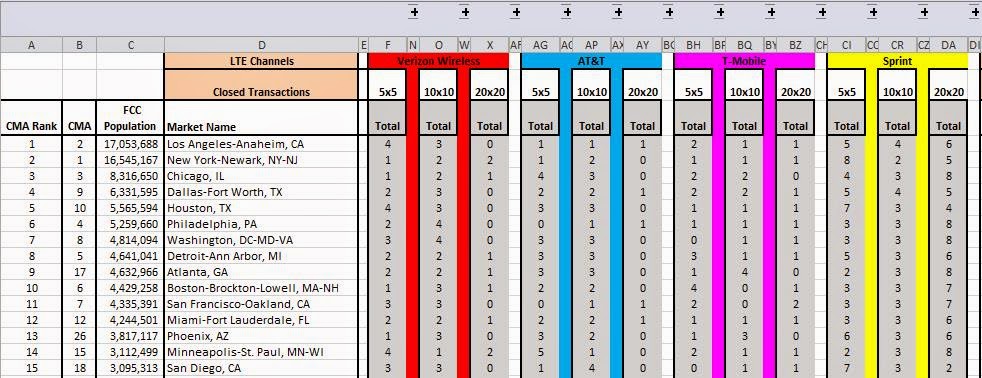 |
| Figure 1 |
By selecting the [+] in the upper margin to the right of AT&T’s 10x10 column we can reveal t AT&T’s LTE channel distribution by band. This expanded view is seen below as Figure 2. 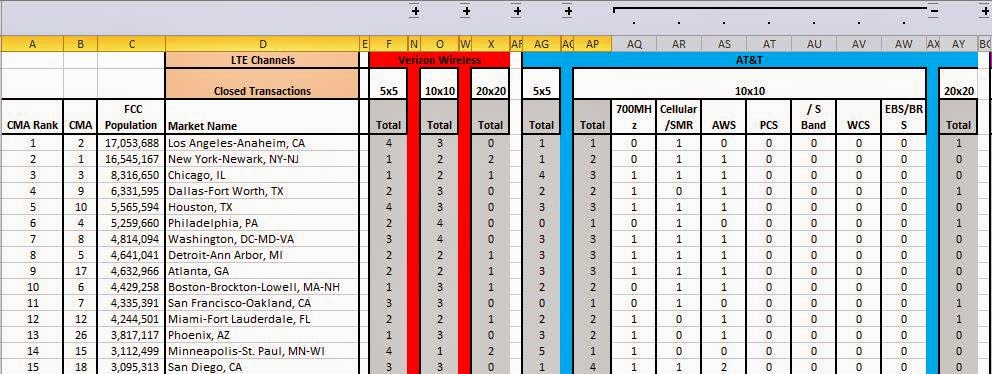 |
| Figure 2 |
AllNet Labs has added a proposed transaction data set to the Spectrum Analysis Tool. With this data set, we are able to simplify hundreds of license transfers at the FCC into the net effect for wireless operators. All of the transactions are captured from the FCC Daily Digest and each license is updated at the callsign, county, and frequency levels. Using this proposed transaction data; a matrix of each carrier’s future LTE Channels is created (Figure 3).  |
| Figure 3 |
By selecting the [+] signs in the upper margin, a carrier’s spectrum holdings by band can be detailed. (Figure 4). |
| Figure 4 |
The last matrix in this report summarizes the differences between the proposed LTE Channels and the current LTE Channels. This highlights areas that are affected by proposed transactions. The example shown uses data from the December 2013 Spectrum Analysis Tool. The proposed transactions for December 2013 were transactions announced prior to 12/1 which included AT&T’s purchase of Leap as well as many other minor transactions. The effect of that transaction as well as other more minor transactions is easily seen in Figure 5, with AT&T increasing their LTE channel size from 5x5 to 10x10 in Chicago. |
| Figure 5 |
To see the changes at the spectrum band level of detail, select the [+] in the upper margin as described before. As seen in Figure 6, AT&T’s increase in 10x10 channels in Chicago was the result of an increase in the PCS spectrum band.
 |
| Figure 6 |
AllNet Lab's Spectrum Analysis Tool is an Excel based product which allows users to visualize and analyze the current spectrum ownership for all of the mobile carrier and satellite frequency bands at a county level for all 50 states and US territories. The Spectrum Analysis Tool includes 15 color-coded spectrum holders and over 600 additional identified carriers. More information can be found at www.allnetlabs.com.
AllNet Labs is now offering a monthly spectrum report summarizing the spectrum holdings for the National Carriers (Verizon, AT&T, Sprint, and T-Mobile). To develop this report, AllNet Labs takes the spectrum outputs at a county level from its Spectrum Analysis Tooland applies a county population weighting before averaging all of the counties within a Cellular Market Area (CMA). Data is available for all 733 CMA markets, but the standard report is formatted for the 100 most populated CMA markets. This report is delivered as an Excel spreadsheet, with both summary and detailed views. In the summary view (Figure 1), only the total spectrum holdings for each carrier are displayed. |
| Figure 1 |
By selecting the [+] in the upper margin to the right of AT&T spectrum holdings we can reveal AT&T’s spectrum distribution by band. This expanded view is seen below as Figure 2. |
| Figure 2 |
AllNet Labs has added a proposed transaction data set to the Spectrum Analysis Tool. With this data set, we are able to simplify hundreds of license transfers at the FCC into the net effect for wireless operators. All of the transactions are captured from the FCC Daily Digest and each license is updated at the callsign, county, and frequency levels. Using this proposed transaction data, a matrix of the national carrier’s proposed spectrum holdings is created (Figure 3).  |
| Figure 3 |
By selecting the [+] signs in the upper margin, a carrier’s spectrum holdings by band can be detailed. (Figure 4). |
| Figure 4 |
The last matrix in this report summarizes the differences between the proposed spectrum holdings and the current spectrum holdings. This highlights areas that are affected by proposed transactions. The example shown uses data from the December 2013 Spectrum Analysis Tool. The proposed transactions for December 2013 were transactions announced prior to 12/1 which included AT&T’s purchase of Leap as well as many other minor transactions. The effect of that transaction as well as other more minor transactions is easily seen in Figure 5, with AT&T increasing their spectrum holdings in 6 of the 15 CMA markets listed. |
| Figure 5 |
To see the changes at the spectrum band level of detail, select the [+] in the upper margin as described before. As seen in Figure 6, AT&T’s increase in spectrum was the result of increases in AWS and PCS spectrum, which matches the known spectrum that Leap will bring to AT&T. |
| Figure 6 |
AllNet Lab's Spectrum Analysis Tool is an Excel based product which allows users to visualize and analyze the current spectrum ownership for all of the mobile carrier and satellite frequency bands at a county level for all 50 states and US territories. The Spectrum Analysis Tool includes 15 color-coded spectrum holders and over 600 additional identified carriers. More information can be found at www.allnetlabs.com.
With the recent industry press indicating that T-Mobile was positioning its self to purchase Verizon's 700 MHz A Block, I decided to dive into the Spectrum Analysis Tool to see what kind of geographic area Verizon's licenses would provide T-Mobile with low band spectrum.
Clearly it would not be a spectrum purchase to provide coverage in rural areas since it doesn't address the rural areas in the western United States with the exception of western Colorado. Looking at it on a Cellular Market (CMA) basis, this spectrum would provide T-Mobile with low band spectrum in all 15 of the Top 20 markets but only 25 of the Top 50 markets. This includes both the Verizon spectrum and T-Mobile's 700MHz spectrum acquired from MetroPCS.
To acquire the remaining 700 MHz A block spectrum in the Top 20 markets, T-Mobile will need to be talking to:
Leap - Chicago
US Cellular - St. Louis
McBride Spectrum - Pittsburg
Cox - San Diego
Vulcan - Seattle
As I was completing my research for an upcoming blog on LTE Carrier Aggregation, I found that my previous LTE Band Class reference sheet was missing some of the more recent Band Class updates, so I decided to share my new reference document with a few comments.
FDD Band Classes:
The first notable band class addition in Band 30. This band class creates a definition for FDD operation in the WCS (2.3GHz) band which was previously defined only for TDD operation.
From the Spectrum Grid view of the Spectrum Ownership and Analysis Tool, you can see that Band 30 does not include the 5MHz channels that AT&T purchased to essentially become guard bands for the Satellite Audio guys. This will provide AT&T with a 10x10 LTE channel on a market by market basis, as they resolve the remaining ownership issues in the WCS band.
The next two band classes are not new, but I previously skipped over these band classes because I didn't fully understand their frequency breaks.
Band 26Previously I thought this was a specific band for Sprint IDEN operation that is adjacent to the cellular band. This is the band where Sprint is placing their 2nd LTE channel (5 MHz) and a CDMA channel (1.23 MHz). Looking at the frequencies in detail, the band class covers the IDEN spectrum and the adjacent cellular spectrum.
This is similar to Sprint's Band 25 which includes all of the PCS band plus their G block spectrum (but not the H block).
So you would think that all of the North American carriers could standardize to Band 25 for PCS operation and Band 26 for Cellular. Using the latest iPhone 5s LTE band support,
you can see the Verizon, T-Mobile, and AT&T iPhone's support Band 2 and 25 for PCS, but only the cellular band (Band 5). Sprint iPhone 5s includes,
both Band 2 and 25 for PCS and Band 5 and 26 for cellular.
Band 10:
This is referenced as the AWS extended band and you can note from above that it is not currently applied to smartphones like the iPhone 5s. This band class seems to be a preparation for the future use of the AWS-2 and AWS-3 spectrum and the government shared use band that are both adjacent to the existing AWS spectrum band. Here is how the downlink looks in the Spectrum Ownership Analysis Tool:
Note that Band 10 does not cover the entire band contemplated for AWS-3, nor does it include Dish's Band 23. For the uplink:
This again depicts that Band 10 is not currently set to include the entire shared government opportunity.
TDD Band Classes:
Here is the reference sheet the TDD band classes.
On this reference sheet I hadn't looked closely at band classes 35, 36, and 37. I had always focused on the 2.3GHz and 2.5GHz as the only bands that were designated for TDD support in North America. These three band classes create 140MHz block of spectrum that could be for TDD deployment. Here is how these bands appear in the Spectrum Ownership Analysis Tool:

I'm not sure what the history is on these band classes, but they would support TDD operation in both the PCS uplink and downlink bands as well as in the 20 MHz between the bands. Since the PCS frequencies are highly deployed, I would consider it very unlikely to see TDD systems in this band in the near future, and I doubt that the PCS band is authorized for TDD operation. It will be interesting to see whether any of the wireless carriers begin to look this direction. With Sprint stepping out of the H block auction, they seem to be signalling that TDD operation is more important to them and the Band 37 block (including Sprint's G block) could be the reason why Dish is pushing forward in the H block auction. Please comment if you are aware why the 3GPP has included these 3 TDD band classes.
Although it surprised the wireless industry a bit, it does make sense that Sprint saw a declining value in the H block spectrum. Acquiring that spectrum would have allowed Sprint to expand their primary LTE Channel from a 5x5 channel to a 10x10 channel. In terms of Mbps, from 37 Mbps per sector to 73 Mbps per sector. If this could be added to the network today, it would bring Sprint to about par with the other 3 national carriers. The problem is timing. It will be mid-2014 before the spectrum will be awarded to the auction winner, but prior to receiving the spectrum, the high bidder could start the 18-24 month process to get the LTE band classifications changed. Sprint would either have expanded the frequencies for their band 25 or requested a new band classification that would include all of the old PCS block, the PCS G block, and the PCS H block. With the standards body work, including carrier aggregation, it would likely by early 2016 before network upgrades would begin. This coincides with their forecasted completion of Project Spark. If Sprint completes this project on-time, they will have 38,000 sites that will be enabled with 40MHz of 2.5GHz spectrum, which could be a game changer. This does seem to signal that Sprint doesn't think their PCS G LTE is particularly strategic.
It is interesting to look at the details of Verizon's spectrum purchase from US Cellular in the St Louis market area (EA-96). Many industry sources talk about how purchase will provide 20MHz for Verizon's LTE. While this is true, it should not be confused with Verizon deploying a 20 x 20 channel. As can be seen from the Spectrum Grid view of AllNet Labs' Spectrum Ownership Analysis Tool, Verizon is purchasing the AWS B channel and previously owned the F channel. Although Verizon will own 20 MHz of spectrum, it is not contiguous and until they can deploy Release 12 software code into their network, they will have to operate this spectrum as two separate 10 MHz channels. Release 12 is likely a 2015 or maybe 2016 release since operators are either planning or deploying Release 10 currently.
The industry talks alot about Carrier Aggregation (CA) but there are several facts that are not well understood. First, Release 10 includes the functionality for carrier aggregation but the frequency band definitions for the US are not included until Release 11. Another point that needs to be understood is that the initial definitions require that aggregated carriers be in contiguous blocks in different spectrum bands (inter-band) or in separate blocks but in the same band (intra-band). For Release 11, only 2 carriers can be aggregated together. For Release 12, Verizon has sponsored a work group that will allow 3 carriers to be aggregated, 1 from the 700MHz band and 2 different carriers from the AWS band. Thus, Release 12 will be necessary for Verizon to aggregate their two AWS blocks of spectrum with their 700 MHz LTE.

The Spectrum Grid view is sorted by the EA geographical area which show that the AWS B and C licenses have not be dis-aggregated. The A channel licenses do show discontinuity since they were originally auctioned as CMA licenses. AT&T through their Leap purchase will strengthen their AWS ownership in this market.
To look at the competitive picture for spectrum in the St Louis market (EA-96) we can look at the
Company By Band worksheet from the AllNet Labs' Spectrum Ownership Analysis Tool. Looking first at Verizon, we can see the variety of spectrum depths across the EA that Verizon indicated in their FCC filing. Verizon will range from 62 MHz to 117 MHz depending on the county. The only county that Verizon controls 117 MHz is Montgomery County, MO which is 40 miles west of St. Louis.
Looking at the other carriers in this market we see that US Cellular will still control between 32 MHz and 69 MHz, while AT&T with their Leap purchase will control between 61 MHz and 105 MHz.
T-Mobile controls between 40 MHz and 60 MHz with two counties at 70 MHz and Sprint with their Clearwire purchase controls between 130 MHz and 242 MHz.
For the past month I have been examining the effect of WiFi off-loading based upon my usage habits. To do this leave WiFi turned off so my phone only receives data service from a commercial carrier network. This was not a simple task because the Smartphone network optimizer will continue to request to have WiFi turned on and whenever you are using location services (Google+) not having WiFi provides a notification "to improve you location, please turn on WiFi".
My typical monthly data usage averages around 1.3 GB per month with WiFi enabled. I travel infrequently and have WiFi both at home and work. I think it is important to note that my work WiFi doesn't block YouTube, Pandora, Facebook, or WatchESPN, but I typically use a WiFi only tablet for music streaming or the watching a major sporting event e.g The America's Cup or the MBL playoffs.
In the month of September, I ran 5.7 GB of data in what I consider to be a typical work month. What this equates to is 3.4 GB of data that was off-loaded from the carrier network to the WiFi network for which I also pay. Another way to look at it is that my carrier only sees 1/3 of my usage.
Using some of the wholesale data rates that have been thrown around in the trade press, $5/GB; the cost to support my data usage through a WiFi Off-loading provider would be $17/month. If I am paying my carrier $30/month for my data usage and they pay a Wi-Fi off-loading provider $17/month, they only end up with $13/month to offset their operational expenses (site leases, backhaul costs, employees...)
When you consider the "true" smartphone usage and where the majority of that traffic is handled today, it is clear why cellular carriers have been reluctant to purchase wholesale access to data or a WiFi off-loading partner.
Check back next month. After my billing period closed, I spent the weekend out of town, so streaming two college football games on Saturday (Dish Anywhere) and 1 NFL game on Sunday will all be part of my October usage. With just 9 days on my billing cycle, I have already consumed 3.3 GB.
With the news that Verizon is beginning to turn up some of their AWS spectrum with LTE, I will examine the spectrum available for those LTE deployments in the Top 5 CMAs with the Spectrum Ownership Analysis Tool.
New York:
Verizon clearly holds 40 MHz of AWS spectrum. To see how this spectrum will affect their total LTE capacity I have evaluated the LTE channels that Verizon can deploy based on their stated direction. Based upon Verizon's stated direction I have eliminated any 700 MHz 5x5 LTE channels, any cellular LTE channels, and any PCS LTE channels.
With this analysis, it is evident that Verizon will top out at 223 Mbps across all of the counties in the New York CMA.
Los Angeles: In Los Angeles, I would expect Verizon to be deploying a 10 MHz LTE channel until AT&T has shifted its LTE usage of this AWS channel to it "new" 700MHz B band holding.
At this point Verizon is limited to 2 - 10x10 channels or 146 Mbps throughout the Los Angeles CMA.
Chicago:In Chicago, Verizon holds a 20x20 AWS channel.
This combined with Verizon's 700 MHz C-band (10x10) channel will provide 223 Mbps throughout the Chicago CMA.
Philadelphia:
In Philadelphia, the largest channel Verizon can form is a 10x10 channel. When AT&T gets control of the Leap spectrum assets, I would expect a three-way spectrum trade to allow Verizon, T-Mobile, and AT&T to rationalize their AWS spectrum positions.
For the throughput analysis, the additional 5x5 channel that Verizon can form in the AWS frequency band is included with the 2 - 10x10 channels (AWS and 700) for a total metro throughput of 183 Mbps.
Detroit:In Detroit, Verizon can again form a 20x20 AWS channel.
In the Detroit CMA, Verizon can achieve a metro through put of 223 Mbps.
